
Archive for the ‘general math’ Category
One of the earliest posts I made on Walking Randomly (almost 3 years ago now – how time flies!) described the following equation and gave a plot of it in Mathematica.


Some time later I followed this up with another blog post and a Wolfram Demonstration.
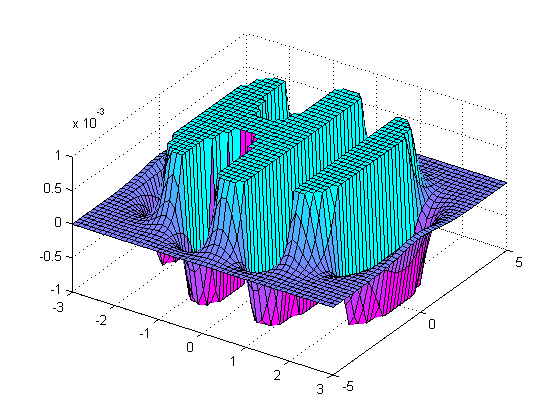
Well, over at Stack Overflow, some people have been rendering this cool equation using MATLAB. Here’s the first version
x = linspace(-3,3,50);
y = linspace(-5,5,50);
[X Y]=meshgrid(x,y);
Z = exp(-X.^2-Y.^2/2).*cos(4*X) + exp(-3*((X+0.5).^2+Y.^2/2));
Z(Z>0.001)=0.001;
Z(Z<-0.001)=-0.001;
surf(X,Y,Z);
colormap(flipud(cool))
view([1 -1.5 2])
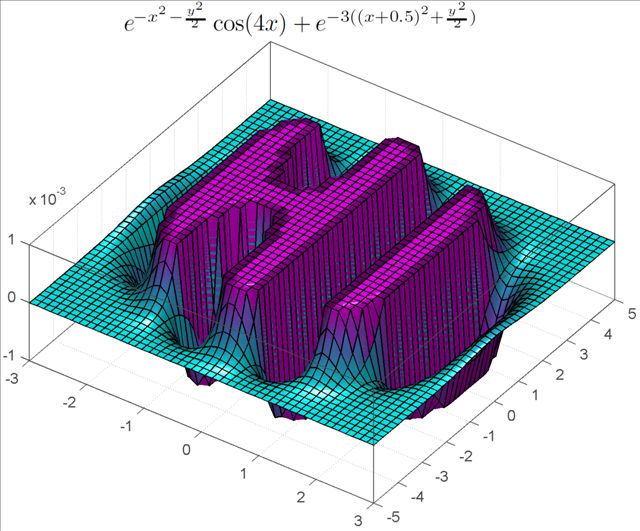
and here’s the second.
[x y] = meshgrid( linspace(-3,3,50), linspace(-5,5,50) );
z = exp(-x.^2-0.5*y.^2).*cos(4*x) + exp(-3*((x+0.5).^2+0.5*y.^2));
idx = ( abs(z)>0.001 );
z(idx) = 0.001 * sign(z(idx));

figure('renderer','opengl')
patch(surf2patch(surf(x,y,z)), 'FaceColor','interp');
set(gca, 'Box','on', ...
    'XColor',[.3 .3 .3], 'YColor',[.3 .3 .3], 'ZColor',[.3 .3 .3], 'FontSize',8)
title('$e^{-x^2 - \frac{y^2}{2}}\cos(4x) + e^{-3((x+0.5)^2+\frac{y^2}{2})}$', ...
    'Interpreter','latex', 'FontSize',12)

view(35,65)
colormap( [flipud(cool);cool] )
camlight headlight, lighting phong
Do you have any cool graphs to share?
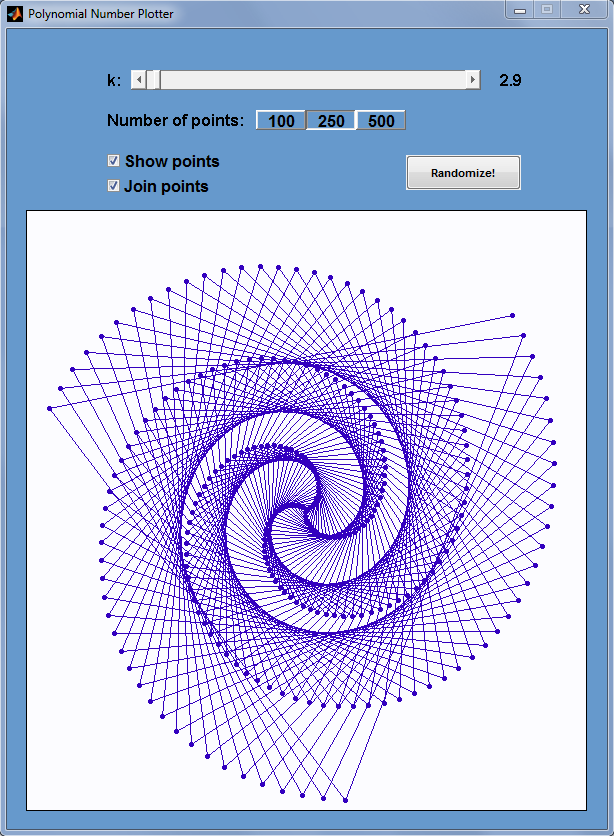
After reading my recent post, Polygonal numbers on quadratic number spirals, Walking Randomly reader Matt Tearle came up with a MATLAB version and it looks great. Click on the image below for the code.
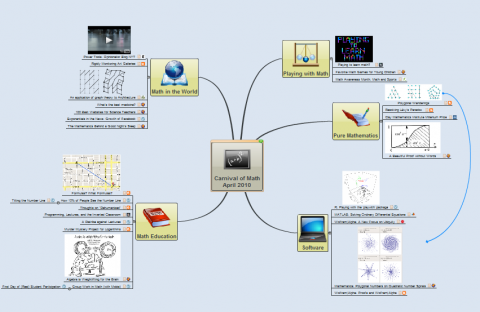
The 64th Carnival of mathematics has been posted over at Maria’s Teaching College Math blog and it is rather different from the norm. Posted as a mind map, it includes articles on a Murder Mystery project for logarithms, weightlifting for the brain, MATLAB, R, the mathematics behind a good night’s sleep and much more.
If you are new to math carnivals and are wondering what is going on then check out my introductory post here.
Other recent carnivals include:
- Math Teachers at Play #24 – posted at Let’s play Math
- Carnival of maths #63 – posted at Mathrecreation
- Math Teachers at Play #23 – posted at Mathrecreation
- Carnival of maths #62 – posted at The Endeavour
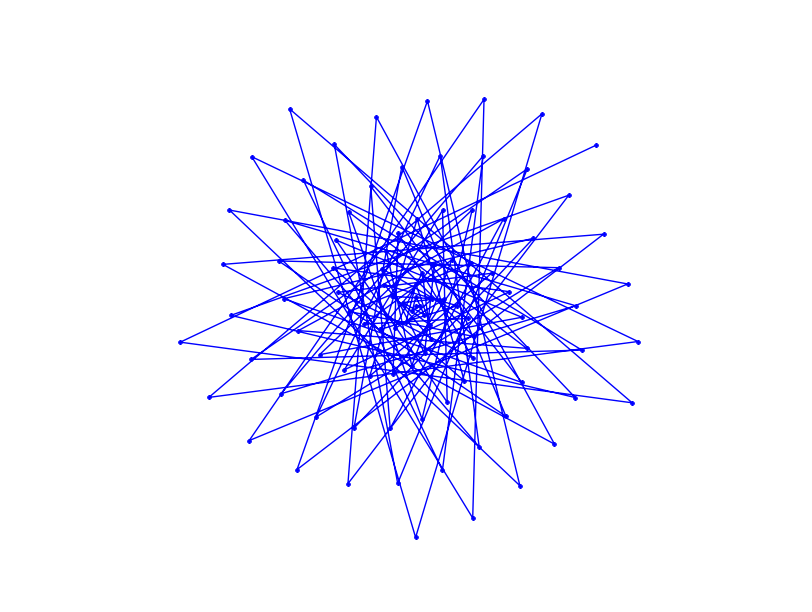
Over at Mathrecreation, Dan Mackinnon has been plotting two dimensional polygonal numbers on quadratic number spirals using a piece of software called Fathom. Today’s train-journey home project for me was to reproduce this work using Mathematica and Python.
I’ll leave the mathematics to Mathrecreation and Numberspiral.com and just get straight to the code. Here’s the Mathematica version:
- Download the Mathematica Notebook
- Download a fully interactive version that will run on the free Mathematica Player
p[k_, n_] := ((k - 2) n (n + 1))/2 - (k - 3) n;
Manipulate[
 nums = Table[p[k, n], {n, 1, numpoints}];
 If[showpoints,
  ListPolarPlot[Table[{2*Pi*Sqrt[n], Sqrt[n]}, {n, nums}]
   , Joined -> joinpoints, Axes -> False,
   PlotMarkers -> {Automatic, Small}, ImageSize -> {400, 400}],
  ListPolarPlot[Table[{2*Pi*Sqrt[n], Sqrt[n]}, {n, nums}]
   , Joined -> joinpoints, Axes -> False, ImageSize -> {400, 400}
   ]
  ]
 , {k, 2, 50, Appearance -> "Labeled"}
 , {{numpoints, 100, "Number of points"}, {100, 250, 500}}
 , {{showpoints, True, "Show points"}, {True, False}}
 , {{joinpoints, True, "Join points"}, {True, False}}
 , SaveDefinitions :> True
 ]
A set of 4 screenshots is shown below (click the image for a higher resolution version). The formula for polygonal numbers, p(kn,n), is only really valid for integer k and so I made a mistake when I allowed k to be any real value in the code above. However, I liked some of the resulting spirals so much that I decided to leave the mistake in.

When Dan showed the images he produced from Fathom, he mentioned that he would one day like to implement these systems in a more open platform. Well, you can’t get much more open than Python so here’s a piece of code that makes use of Python and the matplotlib package (download the file – polygonal_spiral.py).
#!/usr/bin/env python import matplotlib.pyplot as plt from math import * def p(k,n): return(((k-2)*n*(n+1))/2 -(k-3)*n) k=13 polygonal_nums = [p(k,n) for n in range(100)] theta = [2*pi*sqrt(n) for n in polygonal_nums] r = [sqrt(n) for n in polygonal_nums] myplot = plt.polar(theta,r,'.-') plt.gca().axis('off') plt.show() |
Now, something that I haven’t figured out yet is why the above python code works just fine for 100 points but if you increase it to 101 then you just get a single point. Does anyone have any ideas?
Unlike my Mathematica version, the above Python program does not give you an interactive GUI but I’ll leave that as an exercise for the reader.
If you enjoyed this post then you might also like:
According to a new website, if you plot the following equation
then you’ll get the following graph
Head over to the Inverse Graphing Calculator to generate your own. It would be interesting to solve these equations and see if the website is correct.
If you liked this post then you may like this one too: Secret messages hidden inside equations
Someone recently emailed me to say that they thought Mathematica sucked because it couldn’t integrate abs(x) where abs stands for absolute value. The result he was expecting was

When you try to do this in Mathematica 7.0.1, it appears that it simply can’t do it. The command
Integrate[Abs[x], x]
just returns the integral unevaluated
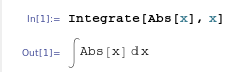
I’ve come across this issue before and many people assume that Mathematica is just stupid…after all it appears that it can’t even do an integral expected of a high school student. Well, the issue is that Mathematica is not a high school student and it assumes that x is a complex variable. For complex x, this indefinite integral doesn’t have a solution!
So, let’s tell Mathematica that x is real
Integrate[Abs[x], x, Assumptions :> Element[x, Reals]]
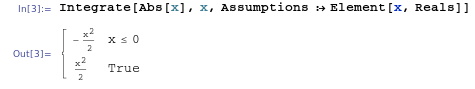
which is Mathematica’s way of saying that the answer is -x^2/2 for x<=0 and x^2/2 otherwise, i.e. when x>0. It’s not quite in the form we were originally expecting but a moments thought should convince you that they are the same thing.
Interestingly, it seems that Wolfram Alpha guesses that you probably mean real x since it just evaluates the integral of abs(x) directly. It does, however, give the result in yet another form: in terms of the signum function, sgn(x):
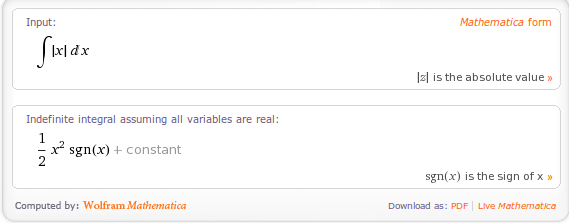
A couple of weeks ago I am pretty sure that Wolfram Alpha gave exactly the same result as Mathematica 7.0.1 so I wonder if they have quietly upgraded the back-end Kernel of Wolfram Alpha. Perhaps this is how Mathematica version 8 will evaluate this result?
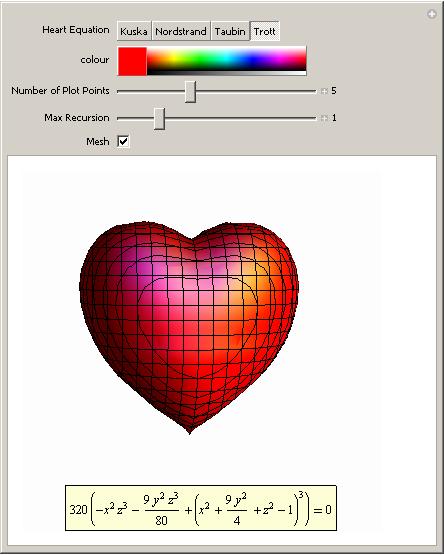
This is not a serious post but then mathematics doesn’t have to be serious all the time does it? Ever wondered what the equation of a 3D heart looks like? An old post of mine will help you find the answer using Mathematica. Click on the image for more details (and a demonstration that you can run using the free Mathematica player).
I don’t save all of my love for Mathematica though. I’ve got some for MATLAB too:
%code to plot a heart shape in MATLAB
%set up mesh
n=100;
x=linspace(-3,3,n);
y=linspace(-3,3,n);
z=linspace(-3,3,n);
[X,Y,Z]=ndgrid(x,y,z);
%Compute function at every point in mesh
F=320 * ((-X.^2 .* Z.^3 -9.*Y.^2.*Z.^3/80) + (X.^2 + 9.* Y.^2/4 + Z.^2-1).^3);
%generate plot
isosurface(F,0)
view([-67.5 2]);
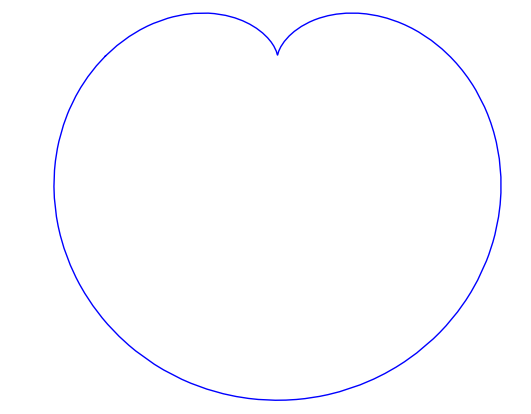
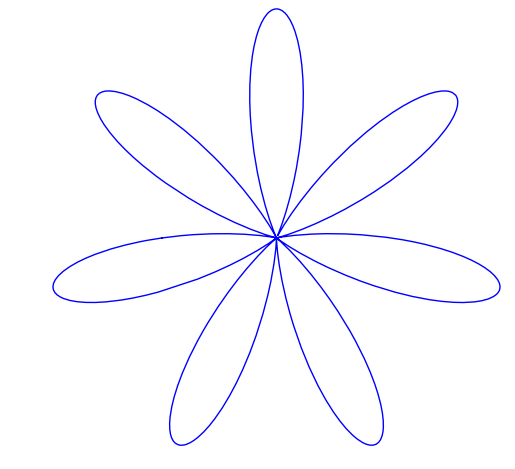
Did you know that the equation for a heart (or a cardioid if you want to get technical) is very similar to the equation for a flower? The polar equation you need is  and you get a rotated cardioid for n=1. Change n to 6 and you get a flower. Let’s use the free maths package, SAGE, this time.
First, define the function:
def eqn(x,n):
    return(1-sin(n*x))
then plot it for n=1
polar_plot(eqn(x,1), (x,-pi, pi),aspect_ratio=1,axes=False)
and for n=7
polar_plot(eqn(x,7), (x,-pi, pi),aspect_ratio=1,axes=False)
Back to Mathematica and the Wolfram Demonstrations project. We have a Valentine’s version of the traditional Tangram puzzle.
Feel free to let me know of any other Valentine’s math that you discover, puzzles, fractals or equations, it’s all good :)
Update Feb 14th 2011
Mariano Beguerisse Díaz sent me some MATLAB code that uses a variation on the standard mandelbrot and I turned it into the movie below. His original code is in the comments section
There are two carnivals in the mathematics blogging world: The Carnival of Maths (CoM) and Math Teachers at Play (MTAP), which are basically two different facets of the same thing — but exactly what are they?
At the most basic level, a maths carnival is just a set of links to recent blog articles about mathematics, but that’s selling the whole idea short somewhat. I’ve always liked to think that the two carnivals are the shop-front of the mathematics blogging world — a reason for us all to get together and celebrate everything that we are proud of in our little corner of the web. Other people compare a blog carnival to a magazine’s table of contents, which can direct you to a wide variety of articles. The articles are written by different people, but they are all tied together by the theme/focus/area-of-interest that defines the magazine.
The best way of demonstrating what the carnivals are all about is to show you some examples, so here are the two most recent editions (I’ll try to keep this updated):
- Carnival of Mathematics #77 – Jost a mon
- Math Teachers at Play #37 – Math Insider
Let’s look at how the carnivals work in more detail.
Say you have just written a recent mathematical blog post which you are rather proud of. Obviously you’d like as many people as possible to read your article, so you choose one of the two carnivals and submit it using one of the two forms below:
- Carnival of Mathematics submission form (Any kind of maths at any level)
- Math teachers at play submission form (Any kind of maths from preK-12 — which is pretty much all mathematics taught to 19 year olds and below)
The carnivial host will receive your submission and, if they think it is suitable, will include it in their carnival. You can then sit back and watch the extra traffic roll in.
Here are some frequently asked questions about both carnivals.
When are the carnivals published?
The Carnival of Maths usually gets published on the first Friday of the month and Math Teachers at Play gets published on the third Friday.
I would like to host a carnival at my blog. What should I do?
Go to the relevant carnival home page and click on ‘Future Hosts’. This will show you who is scheduled to host for the next few months. Find an empty slot that suits you, contact me for the CoM or Denise for MTAP, and we’ll take it from there.
Who does the admin for the Carnivals?
At the moment, I am doing the admin for the Carnival of Math, and Denise of Let’s Play Math is looking after Math Teachers at Play. So, if you have any questions, then we are your first port of call.
I’ve found a cool maths article that someone else has written. Can I submit it to the carnivals?
Yes, but in an ideal world it will be a recent post and should have never been submitted to one of the carnivals before. The best way to be sure of this, if the post is not your own, is to send in only something published since the last edition of the carnival.
Can I submit an article to both carnivals?
We’d rather you didn’t — at least, not the *same* article. We don’t want to bore the audience.
Who decides what gets included in a carnival and what doesn’t.
The carnival hosts. The carnival is just a guest on the host’s blog, and so what each host writes is entirely up to him or her. In general, most carnival hosts will include almost everything that is submitted to them and a bit more besides. However, if they choose NOT to link to something, then so be it.
The blog carnival server has been known to lose submissions on occasion. I have not heard of trouble with the maths carnivals, but the (much larger) Carnival of Education used to have problems quite often. If you are sure that your article met the carnival guidelines, but the host did not include it, then perhaps it simply got lost. Feel free to resubmit your post for the next edition.
Do I have to be a math teacher to submit an article to Math Teachers at Play?
No. As long as the mathematics is below college-level, then you are good to go
Will the Carnival of Math take articles on basic math?
Yes — everything from kindergaten to cutting edge research is fair game for the Carnival of Math. Basic mathematics can be submitted to either carnival, but advanced maths should generally be submitted only to the Carnival of Math.
Do you accept articles from subjects such as computer science or physics?
As long as there is a reasonable amount of maths content, then yes.
Is there anything else I need to do, besides submitting my article?
No, there is nothing else you have to do. When the carnival is published, however, you may want to post a link to it on your blog. The carnival host will appreciate your support, and your readers will enjoy a chance to browse what other math bloggers have written.
Does the carnival have a twitter feed?
Yes, @Carnivalofmath
I’m really late doing this article and it has already been done very well by MathNotations and 360. There’s also a nice game involving the number 2010 over at Let’s play math. They didn’t mention this fact though
2010 = 1+2-(3-4-5)*6*7*8-9
Which I think is nice. Do you have any more interesting facts about the number 2010?
Today is a big day! Not only is it the first day of the new year but it’s also the first day of a new decade! In addition to all of that it is also time for the 61st Carnival of Mathematics and this one has shaped up to be a great one thanks to the growing army of carnival contributors out there. So, put off joining the gym for one more day; Sit back, relax and enjoy this feast of pulchritudinous mathematics.
First off, as per long standing carnival tradition, let’s look at some interesting properties of the number 61. Well, it’s prime for a start but so are a lot of numbers so maybe that isn’t so interesting. However, 61 is the smallest multidigit prime p such that the sum of digits of p^p is a square (pop-quiz – what is the next one?). While on the subject of primes, 61 is the smallest prime who’s digit reversal is square! It also turns out that the 61st Fibonacci number (2504730781961) is the smallest Fibonacci number which contains all the digits from 0 to 9. (Thanks to Number Gossip for these by the way).
So 61 is a lot more interesting than you thought huh? If it had a name then it would be Keith and he would be Australian.

Puzzles, games and problems.
Let’s kick things off with a few puzzles. Sam Shah has submitted a problem for you to try which was originally created by his sister (A physics teacher) in A stubborn equilateral triangle.
If you are in the market for some online math games and lessons then head over to TutorFi.com and see what Meaghan Montrose has found for you.
Jonathan has a very interesting puzzle over at his blog, jd2718, called Who Am I (Teacher Edition) which should keep you thinking while you recover from the new year festivities.
Finally, Erich Friedman has prepared a set of holiday puzzles for 2009 for you all to try.
Explorations, discussions and messing about with maths
Pi is irrational right? Have you ever seen the proof? If not then you need to check out Brent Yorgey’s three part series on the irrationality of Pi over at The Math Less Travelled. Part 3 of this series forms Brent’s submission to today’s carnival.
Pat Ballew has had his math class working on some maximization problems recently and his article Exploring an Isoperimetric Theme discusses a discovery about a “rule of thumb” for some maximization problems. In a later post he wonders if there is a relation between the shape of a polygon and the maxium length of the diagonals (for a fixed perimeter).
Something that has kept potamologists awake over the years is the geometry of meandering rivers. If you’ve ever wondered about the same thing then head over to Division by Zero to see what Dave Richeson has to say on the subject.
Terry Tao has been getting into the holiday season with a ‘more frivolous post than usual’ in A demonstration of the non-commutativity of the English language while Qiaochu Yuan of Annoying Precision gets more serious and considers the combinatorics of words in The cyclotomic identity and Lyndon words.

Matters of a statistical nature
John D. Cook has been contemplating questions involving rare diseases and counterfeit coins over at The Endeavour.
Over at An Ergodic Walk the author has been discussing a statistical problem of how to estimate a probability distribution from samples when you don’t know e.g. how many possible values there are. An example application is estimating the number of different butterfly species from a sample containing many unique species.
I don’t know about you but I like to have a game of cards with my mates from time to time (Poker is our usual game of choice and I am fantastically bad at it). Every now and then a small ‘discussion’ breaks out concerning how shuffled the deck of cards is which is usually solved by somone reshuffling them ‘properly’. But how many suffles are necessary to randomize a deck of cards? Mathematically, card-shuffling can be viewed as a random walk on a finite group and, thus, it can be modeled by a Markov chain. Rod Carvalho has the details.
Techno Techno Techno….the technological side of mathematics
Sage is one of the best free mathematical software packages you can get at the moment and the project is led by William Stein, an associate professor at The University of Washington. In his post Mathematical Software and Me he discusses his past experiences with mathematical software and recounts the series of events that led him to start the development of Sage. If you are interested in Sage and can program in Python and Javascript then you may want to consider my Sage Bounty Hunt.
Wolfram Alpha has been a big hit among mathematics bloggers this year and, since it was launched back in May, Wolfram Research have added a lot of new features to it. For a list of some of the more recent features check out the latest post from the Wolfram Alpha Blog – New Features in Wolfram|Alpha: Year-End Update.
Visualisation of volume data is getting easier every day thanks to products such as MATLAB and Patrick Kalita recently gave an internal talk to Mathworks engineers explaining how to do it. This talk was recorded and turned into a series of 9 blog posts by Doug Hull over at Doug’s MATLAB Video Tutorials and the final part was posted early in December.
Teaching, learning and testing
Explaining mathematics can be hard and there are many different ways of teaching it. In How We Teach, Joel Feinstein shares some of his methodologies and includes a screencast of a talk of his entitled “Using a tablet PC and screencasts when teaching mathematics.”
Every year, many hundreds of mathematics graduate students take language exams where they translate some technical writing in French,German or Russian into English. These translations are then graded and thrown away which seems like a waste of effort when you think about it. David Speyer wonders if there is a more useful way to administer language exams in his post Let’s make language exams useful.
Finally, Eric Mazur has posted a ‘video confession’ on YouTube saying “I thought I was a good teacher until I discovered my students were just memorizing information rather than learning to understand the material. Who was to blame?”
Happy new Year – Math Carnival Style!
Now that it is officially 2010 you will be in need of a new calendar which is where Ron Doerfler of Dead Reckonings comes in. He has created a great looking calendar called The Age of Graphical Computing and has made it all available for free. Just download, print and away you go. I have to confess that I am too lazy to build them myself and so only wish that he could make them available for sale somehow. What about it Ron?
So, that’s it for this edition of the carnival – I hope you enjoyed it. The next one will be published on February 4th and I am still looking for someone to host it. So, if you have blog about mathematics and would like a traffic boost then drop me a line and we’ll discuss it.