
Archive for the ‘just for fun’ Category
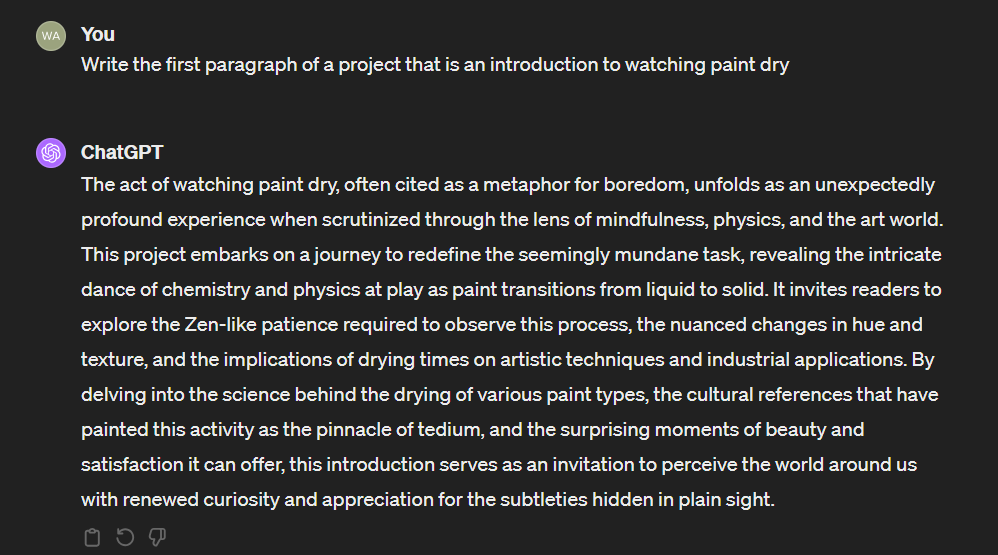
Part of my role at MathWorks involves supporting academics in the use of their tools. Every now and then I get involved with co-supervising projects which usually involves some element of assessment. Ever since the advent of ChatGPT, I have noticed that students like to ‘delve’ into topics a lot more than they used to. The topics that are being delved into often involve a ‘complex interplay’ of something or maybe there’s reference to an ‘intricate dance’ while the reader is invited to go on a ‘journey’.
Obviously (I hope!) the appearance of such statements cannot be used as a ‘ChatGPT detector’ since it seems that no one can make a viable one without too many false positives or by disadvantaging various groups.
I do find it amusing though! Let’s go on a journey and delve into watching paint dry.
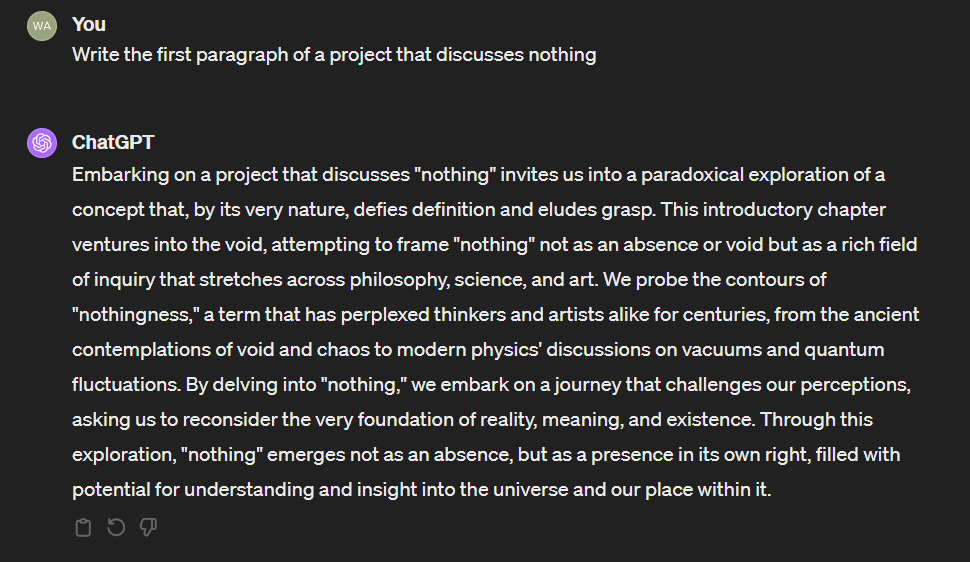
Let’s delve into ‘nothing’ and embark on a journey
Even when stuck in a Traffic Jam, we get to go on a journey. Of course, there is more delving too!
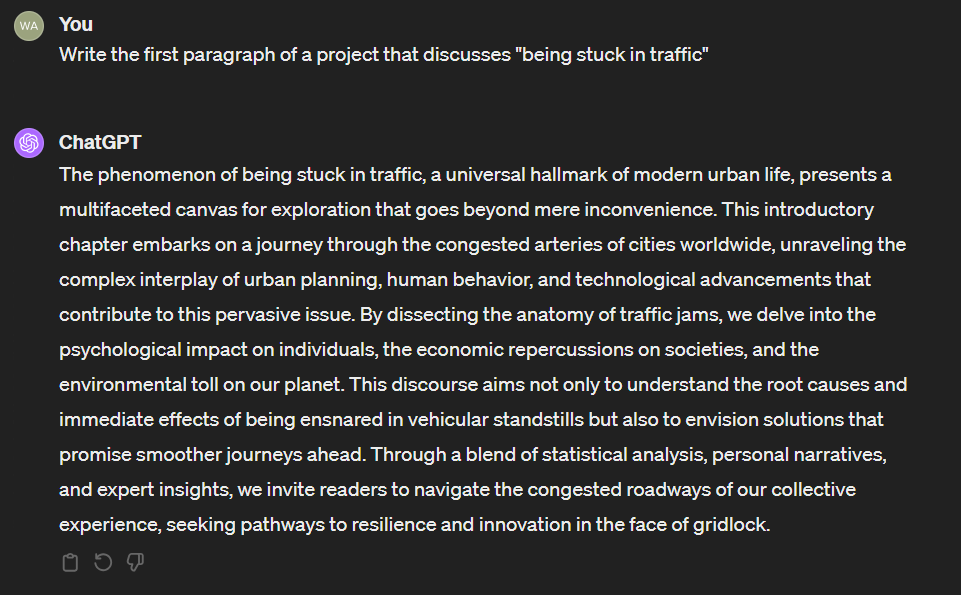
All of the above are interactions with my paid-for ChatGPT 4 account.
Have you noticed this? Do your students delve into things more than they used to? Let me know on Twitter or LinkedIn.
The MATLAB community site, MATLAB Central, is celebrating its 20th anniversary with a coding competition where the only aim is to make an interesting image with under 280 characters of code. The 280 character limit ensures that the resulting code is tweetable. There are a couple of things I really like about the format of this competition, other than the obvious fact that the only aim is to make something pretty!
- No MATLAB license is required! Sign up for a free MathWorks account and away you go. You can edit and run code in the browser.
Stealingreusing other people’s code is actively encouraged! The competition calls it remixing but GitHub users will recognize it as forking.
Here’s an example. I wrote a piece of code to render the Sierpiński triangle – Wikipedia using a simple random algorithm called the Chaos game.
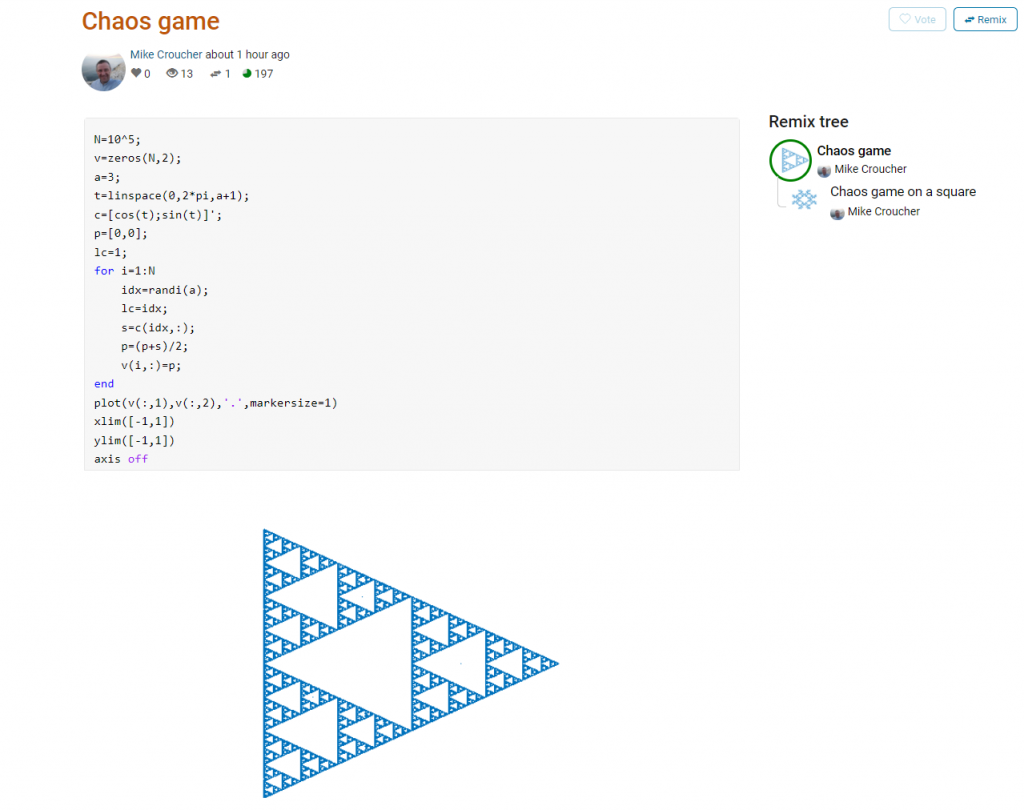
This is about as simple as the Chaos game gets and there are many things that could be done to produce a different image. As you can see from the Remix tree on the right hand side, I’ve already done one of them by changing a from 3 to 4 and adding some extra code to ensure that the same vertex doesn’t get chosen twice. This is result:
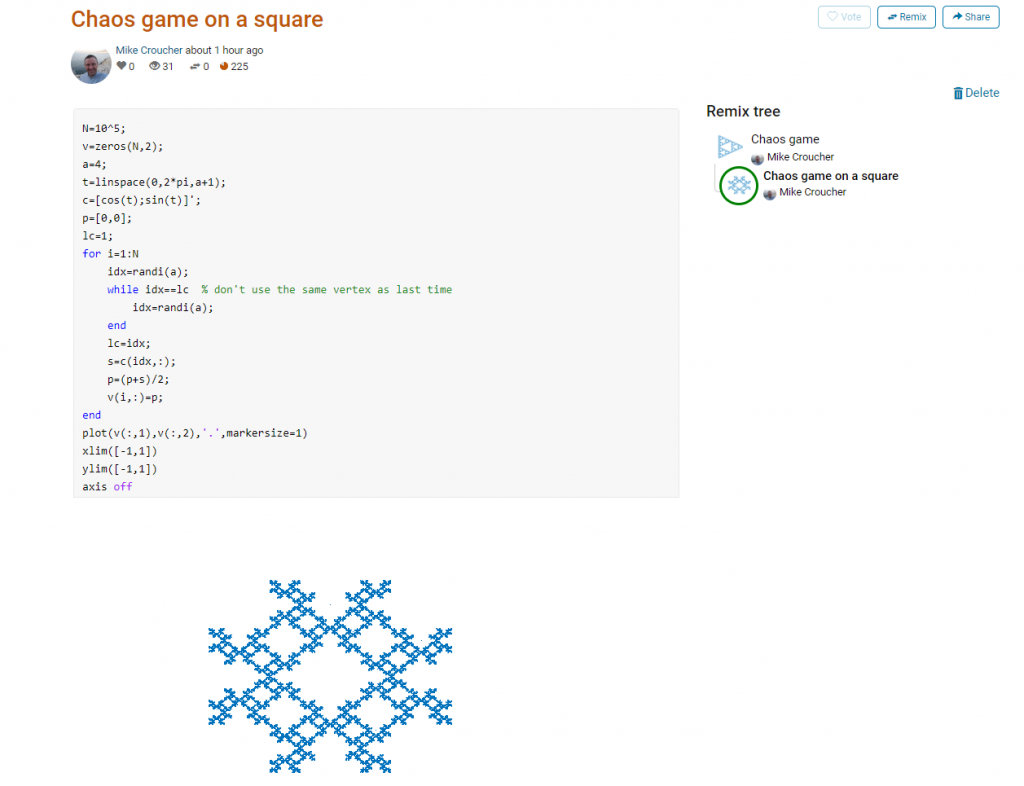
Someone else can now come along, hit the remix button and edit the code to produce something different again. Some things you might want to try for the chaos game include
- Try changing the value of a which is used in the variables t and c to produce the vertices of a polygon on an enclosing circle.
- Instead of just using the vertices of a polygon, try using the midpoints or another scheme for producing the attractor points completely.
- Try changing the scaling factor — currently p=(p+s)/2;
- Try putting limitations on which vertex is chosen. This remix ensures that the current vertex is different from the last one chosen.
- Each vertex is currently equally likely to be chosen using the code idx=randi(a); Think of ways to change the probabilities.
- Think of ways to colorize the plots.
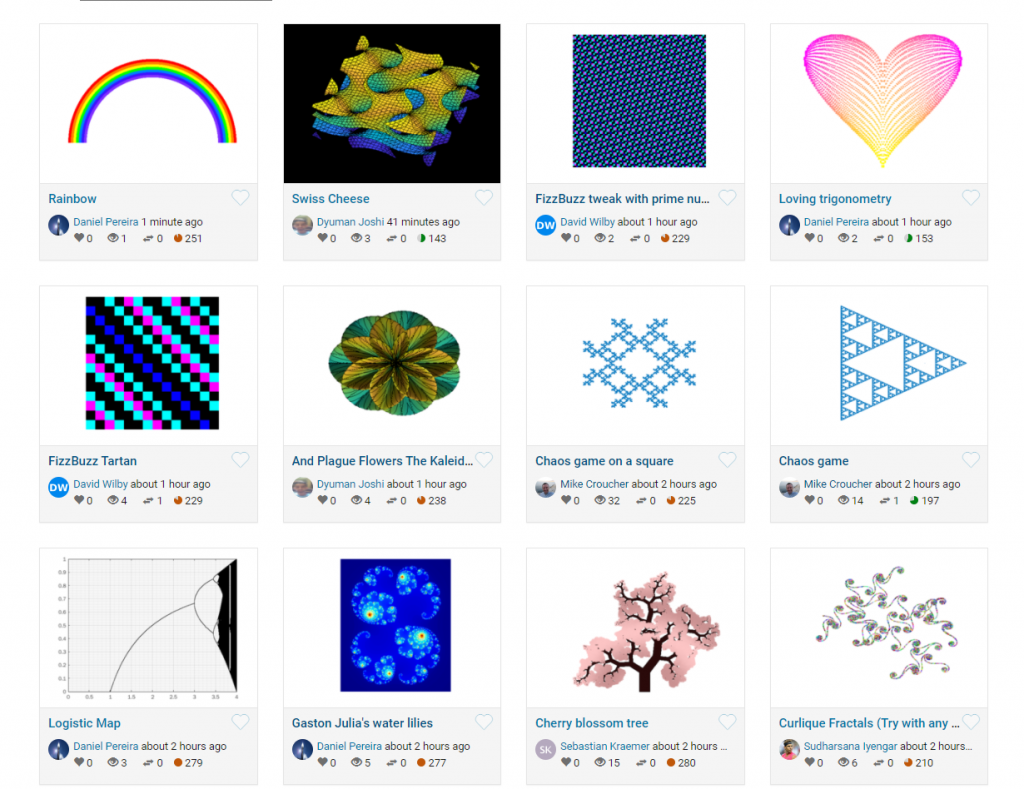
Maybe the chaos game isn’t your thing. You are free to create your own design from scratch or perhaps you’d prefer to remix some of the other designs in the gallery.
The competition is just a few hours old and there are already some very nice ideas coming out.
Some numbers have something to say. Take the following, rather huge number, for example:
185325291040682644803531312384041336595151018761127807725763308064246070395230764956468856341399670487
514610052487586323067575687914642829757636555138456145938430191876551756992329818006401775522301219016
237245425891544032218544390861818271526845858747648909382915665997160517028671058273052955697138350617
856171748990490346558484883522495310587304606877332488244886849690319641412147118669050542398759303832
627672479768452329971883073420877438596419179762421854464516060347269129680634374662501202129049727949
71185874579656679344857677824
This number wants to tell you ‘Happy Holidays’, it just needs a little code to help it out. In Maple, this code is:
n := 18532529104068264480353131238404133659515101876112780772576330806424607039523076495646885634139967048751461005248758632306757568791464282975763655513845614593843019187655175699232981800640177552230121901623724542589154403221854439086181827152684585874764890938291566599716051702867105827305295569713835061785617174899049034655848488352249531058730460687733248824488684969031964141214711866905054239875930383262767247976845232997188307342087743859641917976242185446451606034726912968063437466250120212904972794971185874579656679344857677824:
modnew := proc (x, y) options operator, arrow; x-y*floor(x/y) end proc:
tupper := piecewise(1/2 < floor(modnew(floor((1/17)*y)*2^(-17*floor(x)-modnew(floor(y), 17)), 2)), 0, 1):
points := [seq([seq(tupper(x, y), y = n+16 .. n, -1)], x = 105 .. 0, -1)]:
plots:-listdensityplot(points, scaling = constrained, view = [0 .. 106, 0 .. 17], style = patchnogrid, size = [800, 800]);
The result is the following plot

Thanks to Samir for this one!
The mathematics is based on a generalisation of Tupper’s self-referential formula.
There’s more than one way to send a message with an equation, however. Here’s an image of one I discovered a few years ago — The equation that says Hi

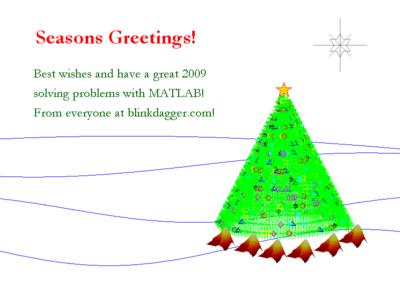
Way back in 2008, I wrote a few blog posts about using mathematical software to generate christmas cards:
- Mathematical Christmas Cards – Walking Randomly Christmas Challenge
- A MATLAB Christmas card
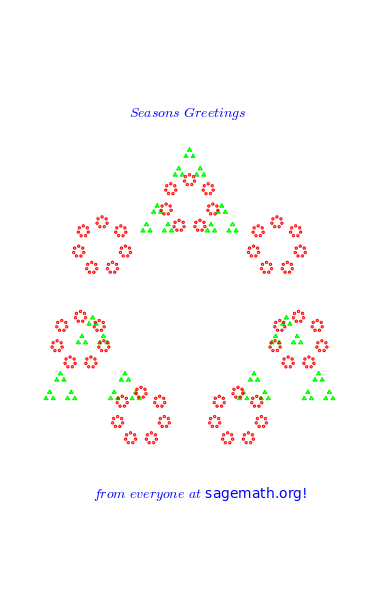
- Christmas geetings – SAGE style
I’ve started moving the code from these to a github repository. If you’ve never contributed to an open source project before and want some practice using git or github, feel free to write some code for a christmas message along similar lines and submit a Pull Request.
A recent trend on Facebook is to create a wordcloud of all of your posts using an external service. I chose not to use it because I tend to use Facebook for personal interactions among close friends and I didn’t want to send all of my data to another external company.
Twitter is a different matter, however! All of the data is open and it’s very easy to write a computer program to generate Twitter world clouds without the need for an external service.
I wrote a simple script in R that generates a wordcloud from the most recent 3200 tweets and outputs the top 200 words (get the code on github). The script removes many of the uninteresting words such as the, of, and that would otherwise dominate the cloud. These stopwords come from the Top100Words list of the R package qdap but I also added a few more such as ‘just’ and ‘me’ that I seem to use a lot.
This is the current wordcloud for my twitter account, walkingrandomly. Click on the image to see a bigger version. My main interests are very clear – Python programming, research software, data and anything that’s new!

Once I had seen my wordcloud, I wondered how things would look for other twitter users who I pay a lot of attention to. This is how it looks for Manchester University’s Nick Higham. Clearly he’s big on SIAM, Manchester, and Matrix Analysis!

I then looked at my manager at Sheffield University, Neil Lawrence. Neil finds data and the city of Sheffield very important and also writes about workshops, science, blog posts and machine learning a lot.

The R code that generated these wordclouds is available on github but it won’t work out of the box. You’ll need to register with twitter for app development (It’s free and fairly straightforward) and get various access keys before you can use the code.
The ever-superb John D. Cook recently found this lovely looking curve in a book he’s currently reading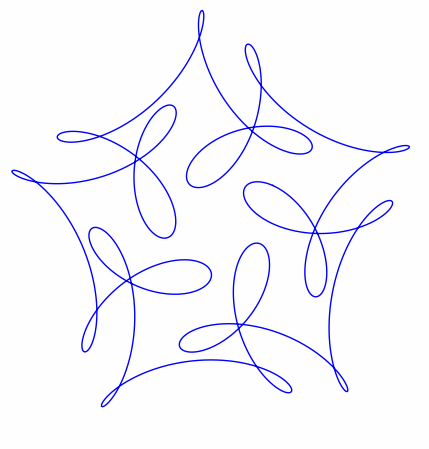
John posted some Python code that reproduced this curve. I stole borrowed his code, put it in a Jupyter notebook and wrapped it in an interactive widget to allow me to play with the parameters and see what other curves I could come up with. The result looks like this.
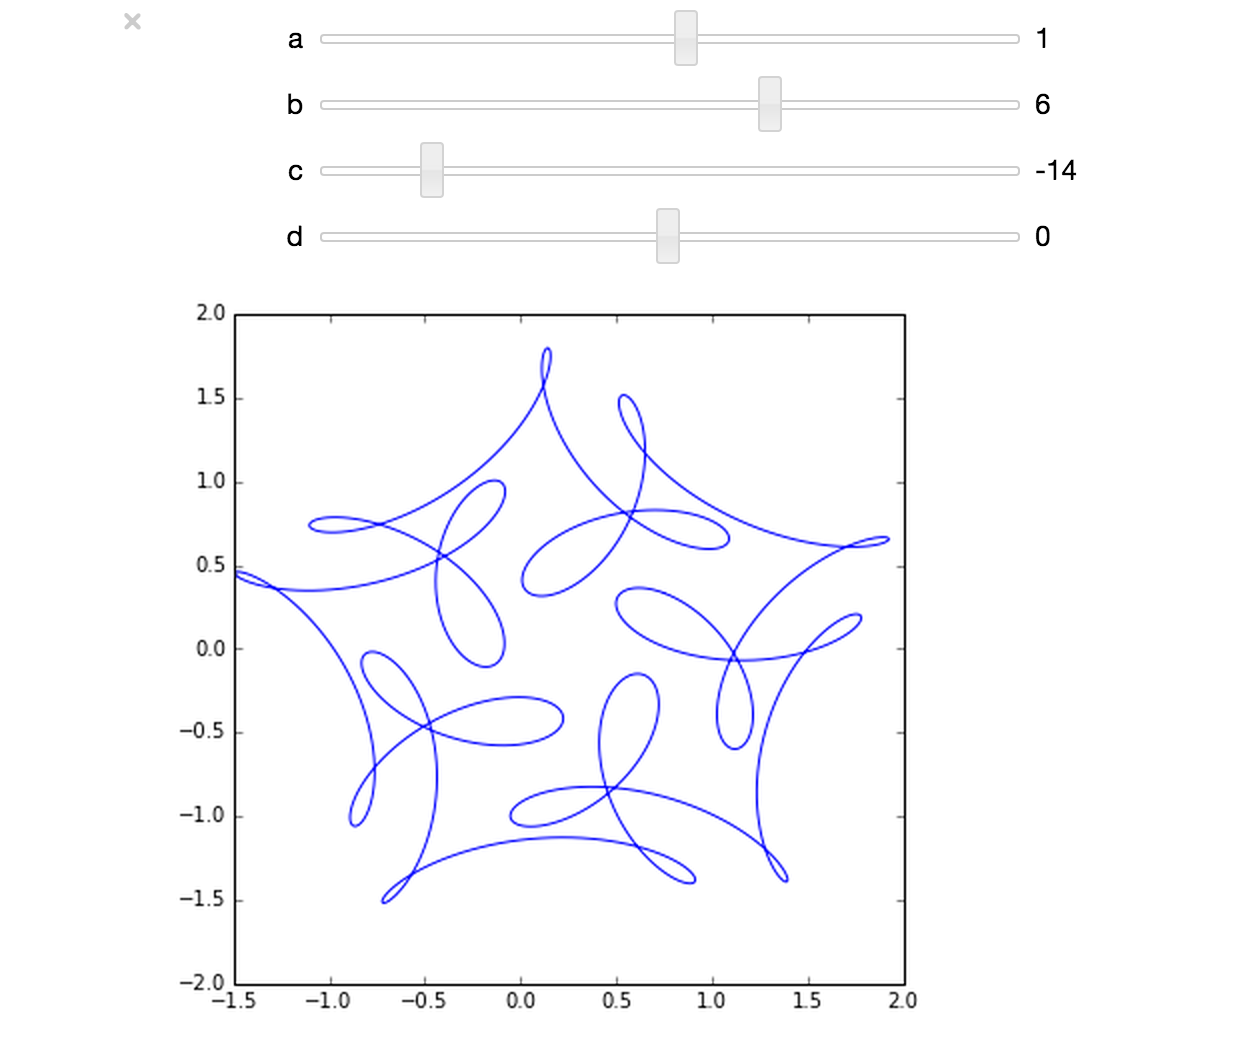
If you’d like something where those sliders work, you need to run the notebook I’ve created in Project Jupyter. Here are 2 ways to do that.
- Download the notebook from github
- Method 1: Upload this notebook to Try Jupyter.
- Method 2: Install Anaconda Python on your machine. Launch the notebook and open the file downloaded above.
Once you have the notebook open, click on Cell->Run All and play with the sliders that pop up.
Other posts about these curves:
- Random cyclic curves – Includes code written in Haskell
- A geogebra applet
A recent Google+ post from Mathemania4u caught my attention on the train to work this morning. I just had to code up something that looked like this and so fired up Mathematica and hacked away. The resulting notebook can be downloaded here. It’s not particularly well thought through so could almost certainly be improved on in many ways.
The end result was a Manipulate which you’ll be able to play with below, provided you have a compatible Operating System and Web browser. The code for the Manipulate is
Manipulate[
 Graphics[Map[dotCirc,
   circArray[circrad, theta, pointsize, extent, step, phase,
    showcirc]]]
 , {{showcirc, True, "Show Circles"}, {True, False}}
 , {{theta, 0, "Dot Angle"}, 0, 2 Pi, Pi/10, Appearance -> "Labeled"}
 , {{pointsize, 0.018, "Dot Size"}, 0, 1, Appearance -> "Labeled"}
 , {{phase, 2, "Phase Diff"}, 0, 2 Pi, Appearance -> "Labeled"}
 , {{step, 0.25, "Circle Separation"}, 0, 1, Appearance -> "Labeled"}
 , {{extent, 2, "Plot Extent"}, 1, 5, Appearance -> "Labeled"}
 , {{circrad, 0.15, "Circle Radius"}, 0.01, 1, Appearance -> "Labeled"}
 , Initialization :>
  {
   dotCirc[{x_, y_, r_, theta_, pointsize_, showcirc_}] := If[showcirc,
     {Circle[{x, y}, r], PointSize[pointsize],
      Point[{x + r Cos[theta], y + r Sin[theta]}]}
     ,
     {PointSize[pointsize],
      Point[{x + r Cos[theta], y + r Sin[theta]}]}]
   ,
   circArray[r_, theta_, pointsize_, extent_, step_, phase_,
     showcirc_] := Module[{},
     Partition[
      Flatten[Table[{x, y, r, theta + x*phase + y*phase, pointsize,
         showcirc}, {x, -extent, extent, step}, {y, -extent, extent,
         step}]], 6]
     ]}]
If you can use the Manipulate below, I suggest clicking on the + icon to the right of the ‘Dot Angle’ field to expose the player controls and then press the play button to kick off the animation.
I also produced a video – The code used to produce this is in the notebook.
)
Back in 2008, I featured various mathematical Christmas cards generated from mathematical software. Here are the original links (including full source code for each ‘card’) along with a few of the images. Contact me if you’d like to add something new.

I am currently in the market for a new thin and light laptop; the things that everyone seems to be calling ultrabooks these days. Here’s what I’ve considered so far and the major good/bad points from my point of view.
- 2013 Macbook Air: Good: Fantastic hardware specs including Haswell and Intel HD 5000. I’ll get an educational discount. Bad: No touchscreen, I’m not interested in OS X. No tablet mode.
- Lenovo Yoga 11s. Good: Both a tablet and a laptop but it’s a laptop first and a tablet second. Bad: Only 3rd generation Intel. Weird to hold in laptop mode because your fingers are mashing the keyboard.
- Haswell based Dell XPS 12. Good:Haswell. Beautiful mechanism for switching between tablet/laptop. Bad: Only Intel HD 4400 graphics compared to the Air’s Intel HD 5000. I’ve heard that the connection between computer and screen is unencrypted WiDi. Possibly just FUD but its putting me off right now.
- Samsung Ativ Book 9 Plus Good: Haswell. Amazing display resolution. Bad: Much higher resolution than the Macbook Air but with weaker GPU (Intel HD 4400)–that surely can’t be a good combination? No tablet mode. Win 8 doesn’t handle such high resolution screens well but should be fixed in 8.1.
- Samsung Ativ Q: Good: Haswell. Amazing display resolution. Tablet mode.Win 8+Android. Bad: No trackpad. Looks horrible in laptop mode–seems to be a tablet first and laptop second. Like the Book 9 plus, it has a relatively weak GPU (Intel HD 4400) to drive all those pixels.
I think that at the moment, what I want is the form factor and weight of the Dell XPS12 with the resolution of the Samsung and the hardware specs of the Air. I’m open to suggestions though.
I am extremely short sighted and have a contact lens prescription of the order of -10 dioptres or so. Recently, I was trying to explain to my wife exactly how I see the world when I am not wearing my contact lenses or glasses and the best I could do was ‘VERY blurry!’
This got me thinking. Would it be possible to code something up that took an input picture and a distance from my eyes and return an image that would show how it looks to my unaided eyes?
Would anyone like to give this a go? How hard could it be?