
MATLAB says “Hi”
One of the earliest posts I made on Walking Randomly (almost 3 years ago now – how time flies!) described the following equation and gave a plot of it in Mathematica.


Some time later I followed this up with another blog post and a Wolfram Demonstration.
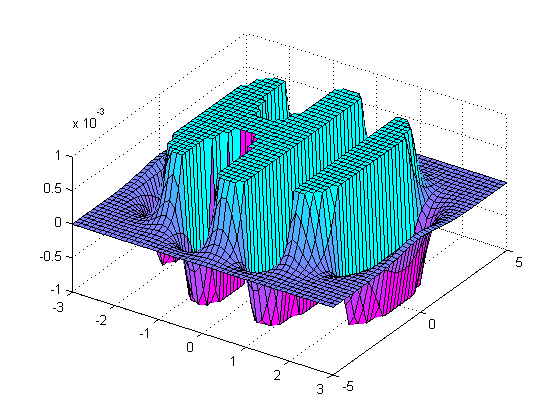
Well, over at Stack Overflow, some people have been rendering this cool equation using MATLAB. Here’s the first version
x = linspace(-3,3,50);
y = linspace(-5,5,50);
[X Y]=meshgrid(x,y);
Z = exp(-X.^2-Y.^2/2).*cos(4*X) + exp(-3*((X+0.5).^2+Y.^2/2));
Z(Z>0.001)=0.001;
Z(Z<-0.001)=-0.001;
surf(X,Y,Z);
colormap(flipud(cool))
view([1 -1.5 2])
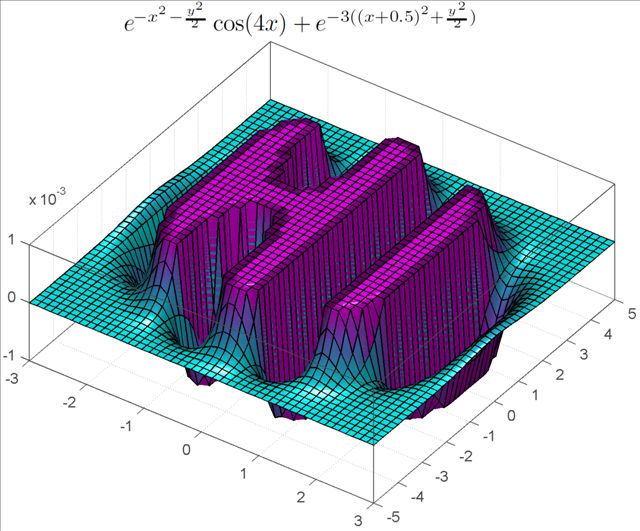
and here’s the second.
[x y] = meshgrid( linspace(-3,3,50), linspace(-5,5,50) );
z = exp(-x.^2-0.5*y.^2).*cos(4*x) + exp(-3*((x+0.5).^2+0.5*y.^2));
idx = ( abs(z)>0.001 );
z(idx) = 0.001 * sign(z(idx));

figure('renderer','opengl')
patch(surf2patch(surf(x,y,z)), 'FaceColor','interp');
set(gca, 'Box','on', ...
    'XColor',[.3 .3 .3], 'YColor',[.3 .3 .3], 'ZColor',[.3 .3 .3], 'FontSize',8)
title('$e^{-x^2 - \frac{y^2}{2}}\cos(4x) + e^{-3((x+0.5)^2+\frac{y^2}{2})}$', ...
    'Interpreter','latex', 'FontSize',12)

view(35,65)
colormap( [flipud(cool);cool] )
camlight headlight, lighting phong
Do you have any cool graphs to share?
Wink:
exp(-(x**2+y**2-32)**2) + exp(-(x+2)**4-(y+2)**4)+exp(-(3*x+6+0.5*y)**4-(y-2)**4) + exp(-(x**2+y**2-16)**2)*(atan(50*x-40)/pi+0.5) + exp(-(8*x**2+y**2-48)**2)*exp(-2*x**2)
Picture at http://picasaweb.google.com/107831669558613198414/Miscellaneous#5483932687034621314
A lot less fascinating than the above eqs. since this one’s rather long.
Do you guess we can do a ‘HELLO WORLD’ ! ….. It may take a long time to develop such ‘potential theory’ type ‘HELLO WORLD’ functions ! …. still worth a try !
@Arkapravo
My guess is “HELLO WORLD” can be done. Starting with exp(-X.^2-Y.^2/2).*cos(8*X) you get 7 vertical type lines for the HELLO part – though getting vertical lines is more troublesome (without messing what you already have too much). Let me see what I can come up with.
I believe the best but hard thing to do is to find the equation for each letter of the alphabet. Then we can write everything we want with simple translations.
Here it is in Maple
f := (x,y)->exp(-x^2-y^2/2)*cos(4*x)+exp(-3*((x+1/2)^2+y^2/2)):
plot3d(f, -2.1..2.1, -5..5, view=[-2.1..2.1,-5..5,-1..0], orientation=[-90,0,0], axes=boxed, grid=[80,80]);
I have posted my plot of “hi” in Matlab.It’s kind of like pudding. Welcome to my blog to take a look. Though my blog is in Chinese, I guess it doesn’t matter. http://www.elly66.com/maths/hi
Hi Elly66
Nice plot – thanks for sharing. Good luck with your blog.
Mike
Nice work, thanks
The same thing with less code to write by using symbolic:
Type
> mupad
in MATLAB, and in the mupad notebook, type
f:=exp(-x^2-y^2/2)*cos(4*x) + exp(-3*((x+1/2)^2+y^2/2))
plot(max(min(f,1/1000),-1/1000),#3D)
change the mesh40/(1+(x-4)^2)+5*sin(20*x/pi) please