March 19th, 2010 | Categories: math software, matlab | Tags:

The latest version of MATLAB – MATLAB 2010a – was released on Friday 5th March. As always, the full list of changes is extensive but some of the highlights from my point of view include the following.

Bug Fixes

MATLAB 2009b contained bugs in some core pieces of functionality.  I am now very happy to report that these have been fixed.

Parallel and Multicore enhancements

Almost everyone has a multicore processor these days and they expect programs such as MATLAB to take full advantage of them.  However, parallel programming can be hard work and so it is impossible to make every function become ‘multicore aware’ overnight.  Almost every release of MATLAB gives us a few more functions that make use of our new multicore processors.

  • Multicore support for several functions from the image processing toolbox.  I’ve added these to my list of known ‘multicore aware’ functions in MATLAB.
  • The Fast Fourier Transform function – fft – was originally made multicore-aware back in release 2009a and this has been improved on in 2010a.  The multithreaded improvements for fft in 2009a were for multichannel Fast Fourier Transforms.  In other words, when taking the FFT of a 2D array, MATLAB computes the FFT of each column on an independent thread.  The improvements in 2010a actually multithread the calculation of a single FFT.  Mathworks refer to this as “long vector” FFT since this speeds up the calculations of a very long fft.

Other articles you may be interested in on parallel programming in MATLAB.

Changes to the symbolic toolbox

The symbolic toolbox for MATLAB is one of my favourite Mathworks products since it offers so much extra functionality.  Most toolboxes are just a set of .m MATLAB files but the symbolic toolbox includes an entire program called MUPAD along with a set of interfaces to MATLAB itself.  Lets look at some of the enhancements developed in 2010a in detail.

  • MuPAD demonstrates better performance when handling some linear algebra operations on matrices containing symbolic elements. Let’s look at symbolic Matrix Inversion for example. Take the following piece of MUPAD code
    x:= 1 + sin(a) + cos(b):
    A:= matrix( [ [11/x + a11, 12/x + a12, 13/x + a13, 14/x + a14],
                  [21/x + a21, 22/x + a22, 23/x + a23, 24/x + a24],
                  [31/x + a31, 32/x + a32, 33/x + a33, 34/x + a34],
                  [41/x + a41, 42/x + a42, 43/x + a43, 44/x + a44] ]):
    time((B:= 1/A))*sec/1000.0;

    On my machine, 2009a did this calculation in 61.1 seconds whereas 2010a did it in 0.9 seconds. That’s one heck of a speedup!

  • Enhanced simplification functions, simplify and Simplify, demonstrate better results for expressions involving trigonometric and hyperbolic functions, square roots, and sums over roots of unity.  There’s a lot of improvements packed into this one bullet point but I’ll just focus on one particular example.  Take the following MUPAD code.
    f:= -( ((x + 1)^(1/2) - 1)
          *((1 - x)^(1/2) - 1)*(4*x*(x + 1)^(1/2) + 8*(1 - x)^(1/2)*(x + 1)^(1/2) + 4*(x + 1)^(1/2)
         + 12*(x + 1)^(3/2) - 4*x*(1 - x)^(1/2) + 4*(1 - x)^(1/2) + 12*(1 - x)^(3/2) - 8*x^2 - 40)
         ) /(6*((x + 1)^(1/2) + (1 - x)^(1/2) - 2)^3)
         - (1/3*(x + 1)^(3/2) + 1/3*(1 - x)^(3/2)):
    simplify(f)

    If you evaluate this in the MUPAD notebook of release 2009b then you get a big mess. Evaluating it in 2010a, on the other hand, results in 0. Much tidier!

  • Polynomial division has improved functionality. In R2009b it was not possible to divide multivariate polynomials with remainder,only exact division was possible. R2010a returns the quotient and the remainder. Consider the following MUPAD code.
    q := poly(x+y^2+1):
    p := poly(x^2+y)*q + poly(y^3+x)*q + poly(x^2+y^2+1):
    divide(p, q);

    2009b MUPAD just gives an error message

    Error: Illegal argument [divide]

    2010a,on the other hand, gives us what we want returning the quotient and the remainder.

    poly(x^2 + 2*x + y^3 - y^2 + y - 1, [x, y]), poly(y^4 + 3*y^2 + 2, [x, y])
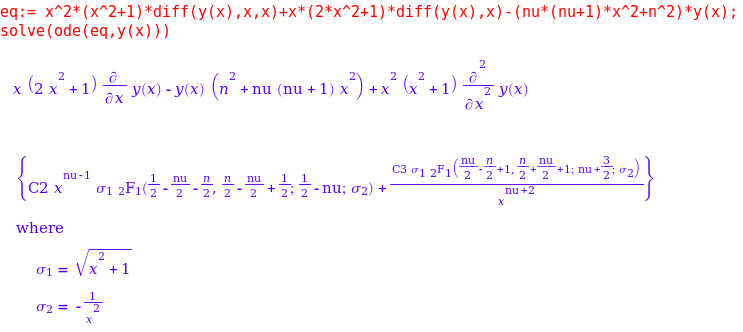
  • The symbolic ODE solver in MUPAD now handles many more equation types. Here’s a particular example of a 2nd order linear ODE with hypergeometric solutions that can now be solved.
  • eq:= x^2*(x^2+1)*diff(y(x),x,x)+x*(2*x^2+1)*diff(y(x),x)-(nu*(nu+1)*x^2+n^2)*y(x);
    solve(ode(eq,y(x)))

    MUPAD ODE solution

    This is just a small selection of the enhancements that The Mathworks have made to the symbolic toolbox which is coming along in leaps and bounds in my humble opinion.  Thanks to various members of staff at The Mathworks for supplying me with these examples (and a fair few more besides). I wouldn’t have been able to make this post without them.

Other articles on Walking Randomly about the symbolic toolbox for MATLAB:

Changes to the Optimization toolbox

  • The fmincon function now has a new algorithm available.  The algorithm is called SQP which stands for Sequential Quadratic Programming. I don’t know much about it yet but may return to this in the future.

Licensing changes

Licensing and toolbox naming might be dull for most people – but it is a big deal to me since I work in a team that administers a large network license for MATLAB.  Changes that might seem minor to most people can result in drastic improvements for the life of a network license administrator.  On the other hand, some changes can result in massive amounts of work.

  • Solaris as a network license platform was dropped.  This is a shame because although my employer has very few Solaris client machines, it currently runs its MATLAB license server on Solaris and it has been (and continues to be) rock solid.  Now we are going to have to move to Windows license servers and update every single client machine on campus before we can update to 2010a.  Oh joys!
  • The Genetic Algorithm and Direct Search toolbox is no more.  It’s functionality is now part of the Global Optimization Toolbox.  I’ve not used this one myself yet but it does have a small core set of users at my university.

Articles aimed at users of MATLAB network licenses include

Much of the fine detail in this article was provided to me by members of staff at The Mathworks.  I thank them all for their time, patience and expertise in answering my incessant questions.  Any mistakes, however, are my fault!

If you enjoyed this article, feel free to click here to subscribe to my RSS Feed.

March 5th, 2010 | Categories: math software, matlab, programming | Tags:

A little while ago I was having a nice tea break when all hell broke loose.  Complaint after complaint started rolling in about lack of network licenses for the MATLAB statistics toolbox and everyone was wondering what I intended to do about it.  A quick look at our license server indicated that someone had started a large number of MATLAB jobs on a Beowulf cluster and all of them used the statistics toolbox.  Slowly but surely, he was eating up every statistics toolbox license in the university.

I contacted him, explained the problem and he terminated all of his jobs.  Life returned to normal for the rest of the university but now he couldn’t work.  What to do?

One option was to compile his code using the MATLAB compiler and send the resulting binaries to the cluster but I took another route.  I had a look through his code and discovered that he was only ever calling one function from the Statistics toolbox and that was

random('unif',0,1)

All this does is give a uniform random number between 0 and 1. However, if you code it like this

rand()

then you won’t use a license from the statistics toolbox since rand() is part of basic MATLAB. Of course most people don’t want a random number between 0 and 1; instead they will want a random number between two constants, a and b. In almost all cases the following two statements are mathematically equivalent

r = a + (b-a).*rand();     %Doesn't use a license for the statistics toolbox
r = random('unif',a,b);    %Does use a license for the statistics toolbox

The statistics toolbox function, random(), is much more general than rand() since it can give you random numbers from many different distributions but you are wasting a license token if you use it for the uniform distribution. The same goes for the normal distribution for that matter since basic MATLAB has randn().

random('norm',mu,sigma);  %does use a stats license
r = randn()* sigma + mu;  %doesn't use a stats license

The moral of the story is that when you are using MATLAB in a network licensed environment, it can sometimes pay to consider how you spell your functions ;)

March 4th, 2010 | Categories: general math | Tags:

According to a new website, if you plot the following equation
Walking Randomly

then you’ll get the following graph
Walking Randomly
Head over to the Inverse Graphing Calculator to generate your own.  It would be interesting to solve these equations and see if the website is correct.

If you liked this post then you may like this one too: Secret messages hidden inside equations

March 2nd, 2010 | Categories: matlab | Tags:

One of MATLAB’s strengths is that it has a toolbox for almost everything.  One of it’s weaknesses is that you have to pay separately for them all!  Basic MATLAB is cheaper for most people than basic Mathematica but, in my experience at least, many people need access to statistics, optimization,symbolics, curve fitting and (increasingly) parallel toolboxes before they get functionality equivalent to Mathematica.  By the time one has bought all of those additional toolboxes, MATLAB doesn’t look quite so cheap!

I am growing a list of quality, free MATLAB toolboxes and it is clear that the world could do with more.  So, I have a question for you all.  If you could have one MATLAB toolbox for free then which one would it be?

March 1st, 2010 | Categories: math software, matlab, NAG Library, programming | Tags:

The Problem

A MATLAB user came to me with a complaint recently.  He had a piece of code that made use of the MATLAB Statistics toolbox but couldn’t get reliable access to  a stats toolbox license from my employer’s server.  You see, although we have hundreds of licenses for MATLAB itself, we only have a few dozen licenses for the statistics toolbox.  This has always served us well in the past but use of this particular toolbox is on the rise and so we sometimes run out which means that users are more likely to get the following error message these days

??? License checkout failed.
License Manager Error -4
Maximum number of users for Statistics_Toolbox reached.
Try again later.
To see a list of current users use the lmstat utility or contact your License Administrator.

The user had some options if he wanted to run his code via our shared network licenses for MATLAB (rather than rewrite in a free language or buy his own, personal license for MATLAB):

  • Wait until a license became free.
  • Wait until we found funds for more licenses.
  • Buy an additional license token for himself and add it to the network (235 pounds +VAT currently)
  • Allow me to gave a look at his code and come up with another way

He went for the final option.  So, I sat with a colleague of mine and we looked through the code.  It turned out that there was only one line in the entire program that used the Statistics toolbox and all that line did was call binopdf.  That one function call almost cost him 235 quid!

Now, binopdf() simply evaluates the binomial probability density function and the definition doesn’t look too difficult so you may wonder why I didn’t just cook up my own version of binopdf for him?  Quite simply, I don’t trust myself to do as good a job as The Mathworks.  There’s bound to be gotchas and I am bound to not know them at first.  What would you rather use, binpodf.m from Mathworks or binopdf.m from ‘Dodgy Sysadmin’s Functions Inc.’?  Your research depends upon this function remember…

NAG to the rescue!

I wanted to use a version of this function that was written by someone I trust so my mind immediately turned to NAG (Numerical Algorithms Group) and their MATLAB toolbox which my employer has a full site license for.  The NAG Toolbox for MATLAB has a function called g01bj which does what we need and a whole lot more.  The basic syntax is

[plek, pgtk, peqk, ifail] = g01bj(n, p, x)

From the NAG documentation: Let X denote a random variable having a binomial distribution with parameters n and p. g01bj calculates the following probabilities

  • plek = Prob{X<=x}
  • pgtk = Prob{X > x}
  • peqk = Prob{X = x}

MATLAB’s binopodf only calculates Prob(X=x) so the practical upshot is that for the following MATLAB code

n=200;
x=0;
p=0.02;
y=binopdf(x,n,p)

the corresponding NAG Toolbox code (on a 32bit machine) is

n=int32(200);
x=int32(0);
p=0.02;
[plek, pgtk, y, ifail] = g01bj(n, p, x);

both of these code snippets gives

y =
    0.0176

Further tests show that NAG’s and MATLAB’s results agree either exactly or to within what is essentially numerical noise for a range of values. The only thing that remained was to make NAG’s function look more ‘normal’ for the user in question which meant creating a file called nag_binopdf.m which contained the following

function pbin = nag_binopdf(x,n,p)
   x=int32(x);
   n=int32(n);
   [~,~,pbin,~] = g01bj(n,p,x);
end

Now the user had a function called nag_binopdf that behaved just like the Statistics toolbox’s binopdf, for his particular application, argument order and everything.

It’s not all plain sailing though!

As good as the NAG toolbox is, it’s not perfect.  Note that I placed particular emphasis on the fact that we had come up with a suitable, drop-in replacement for binopdf for this user’s particular application.  The salient points of his application are:

  • His input argument, x, is just a single value – not a vector of values. The NAG library wasn’t written with MATLAB in mind, it’s written in Fortran, and so many of its functions are not vectorised (some of them are though).  In Fortran this is no problem at all but in MATLAB it’s a pain.  I could, of course, write a nag_binopodf that looks like it’s vectorised by putting g01bj in a loop hidden away from the user but I’d soon get found out because the performance would suck.  To better support MATLAB users, NAG needs to write properly vectorised versions of its functions.
  • He only wanted to run his code on 32bit machines. If he had wanted to run it on a 64bit machine then he would have to change all of those int32() calls to int64().  I agree that this is no big deal but it’s something that he wouldn’t have to worry about if he had coughed up the cash for a Mathworks statistics license.

Final thoughts

I use the NAG toolbox for MATLAB to do this sort of thing all the time and have saved researchers at my university several thousand pounds over the last year or so through unneeded Mathworks toolbox licenses.  As well as statistics, the NAG toolbox is also good for optimisation (local and global), curve fitting, splines, wavelets, finance,partial differential equations and probably more.  Not everyone likes this approach and it is not always suitable but when it works, it works well.  Sometimes, you even get a significant speed boost into the bargain (check out my interp1 article for example).

Comments are, as always, welcomed.

Blog posts similar to this one

February 27th, 2010 | Categories: Mac OS X, mathematica | Tags:

On a Linux machine with a normal install of Mathematica you can usually get access to a command line version of Mathematica by typing

math

at the command line.  Command line Mathematica is useful for situations where you want to do batch processing, perhaps as part of a Condor pool or something, but I’ll not write about that until another time.

On a Mac, however, a standard install of Mathematica doesn’t give you a math command so you have to create it yourself.  Add the following line to your system’s /etc/bashrc file.

alias math="/Applications/Mathematica.app/Contents/MacOS/MathKernel"

Now, when you type math at the command prompt it will behave just like a Linux system which is sometimes useful.

February 17th, 2010 | Categories: general math, math software, mathematica, Wolfram Alpha | Tags:

Someone recently emailed me to say that they thought Mathematica sucked because it couldn’t integrate abs(x) where abs stands for absolute value.  The result he was expecting was

\int|x| \,dx = \frac{|x|x}{2}

When you try to do this in Mathematica 7.0.1, it appears that it simply can’t do it. The command

Integrate[Abs[x], x]

just returns the integral unevaluated
unevaluated Integral of abs(x)
I’ve come across this issue before and many people assume that Mathematica is just stupid…after all it appears that it can’t even do an integral expected of a high school student. Well, the issue is that Mathematica is not a high school student and it assumes that x is a complex variable. For complex x, this indefinite integral doesn’t have a solution!

So, let’s tell Mathematica that x is real

Integrate[Abs[x], x, Assumptions :> Element[x, Reals]]

Evaluated Integral of abs(x)
which is Mathematica’s way of saying that the answer is -x^2/2 for x<=0 and x^2/2 otherwise, i.e. when x>0. It’s not quite in the form we were originally expecting but a moments thought should convince you that they are the same thing.

Interestingly, it seems that Wolfram Alpha guesses that you probably mean real x since it just evaluates the integral of abs(x) directly. It does, however, give the result in yet another form: in terms of the signum function, sgn(x):
Wolfram Alpha Integral of abs(x)

A couple of weeks ago I am pretty sure that Wolfram Alpha gave exactly the same result as Mathematica 7.0.1 so I wonder if they have quietly upgraded the back-end Kernel of Wolfram Alpha.  Perhaps this is how Mathematica version 8 will evaluate this result?

February 10th, 2010 | Categories: general math | Tags:

This is not a serious post but then mathematics doesn’t have to be serious all the time does it?  Ever wondered what the equation of a 3D heart looks like?  An old post of mine will help you find the answer using Mathematica.  Click on the image for more details (and a demonstration that you can run using the free Mathematica player).

math for yor valentine

I don’t save all of my love for Mathematica though. I’ve got some for MATLAB too:

%code to plot a heart shape in MATLAB
%set up mesh
n=100;
x=linspace(-3,3,n);
y=linspace(-3,3,n);
z=linspace(-3,3,n);
[X,Y,Z]=ndgrid(x,y,z);
%Compute function at every point in mesh
F=320 * ((-X.^2 .* Z.^3 -9.*Y.^2.*Z.^3/80) + (X.^2 + 9.* Y.^2/4 + Z.^2-1).^3);
%generate plot
isosurface(F,0)
view([-67.5 2]);

Did you know that the equation for a heart (or a cardioid if you want to get technical) is very similar to the equation for a flower?  The polar equation you need is  
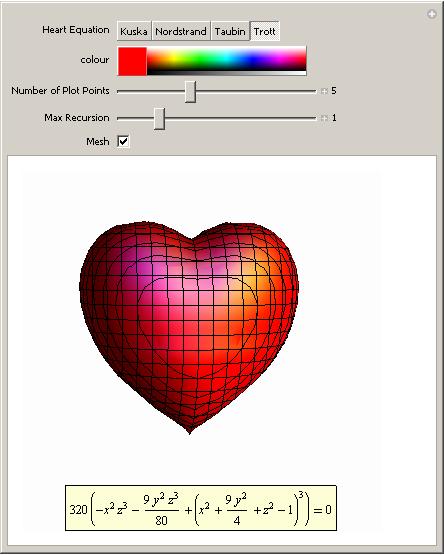
and you get a rotated cardioid for n=1.  Change n to 6 and you get a flower.  Let’s use the free maths package, SAGE, this time.

First, define the function:

def eqn(x,n):
    return(1-sin(n*x))

then plot it for n=1

polar_plot(eqn(x,1), (x,-pi, pi),aspect_ratio=1,axes=False)

SAGE heart
and for n=7

polar_plot(eqn(x,7), (x,-pi, pi),aspect_ratio=1,axes=False)

SAGE heart

Back to Mathematica and the Wolfram Demonstrations project. We have a Valentine’s version of the traditional Tangram puzzle.

Broken Heart Tangram

Feel free to let me know of any other Valentine’s math that you discover, puzzles, fractals or equations, it’s all good :)

Update Feb 14th 2011

Mariano Beguerisse Díaz sent me some MATLAB code that uses a variation on the standard mandelbrot and I turned it into the movie below.  His original code is in the comments section

February 9th, 2010 | Categories: math software, matlab | Tags:

MATLAB is an extremely popular system in which to do computation of any kind.  In addition to the basic MATLAB package, The Mathworks sell dozens of add-on toolboxes for specialist (and not-so specialist) subject areas including curve fitting, statistics, bioinformatics, wavelet analysis, splines, optimisation, parallel computing and much more.  Although they are very good, these toolboxes can be rather expensive, especially if you find yourself needing several of them.

There are many free MATLAB toolboxes available which vary in quality from superb to complete trash and, obviously, you are only interested in the superb ones.  The following MATLAB toolboxes are all free and they are all very good – in every case I know at least one research group (who’s opinion I respect) that uses them extensively.

  • Chebfun – The chebfun project is a collection of algorithms, and a software system in object-oriented MATLAB, which extends familiar powerful methods of numerical computation involving numbers to continuous or piecewise-continuous functions.
  • IFISS Software Package – The IFISS software can be used to generate typical linear systems arising from finite element discretizations of steady and unsteady diffusion, convection-diffusion, Stokes flow and Navier-Stokes flow problems.
  • NaN Toolbox for MATLAB and Octave –  A statistics and machine learning toolbox for MATLAB
  • N-Way Toolbox for MATLAB – The N-way Toolbox for MATLAB  is a freely available collection of functions and algorithms for modelling multiway data sets by a range of multilinear models.
  • MATLAB tensor toolbox – Tensors (also known as multidimensional arrays or N-way arrays) are used in a variety of applications ranging from chemometrics to psychometrics.
  • NLEVP: A Collection of Nonlinear Eigenvalue Problems – This contains problems from models of real-life applications as well as problems constructed specifically to have particular properties.
  • pMATLAB – A free parallel computing toolbox for MATLAB.  Check out the book here.
  • Poblano toolbox for MATLAB – Poblano is a Matlab toolbox of large-scale algorithms for unconstrained nonlinear optimization problems.
  • Statistical Parametric Mapping – The SPM software package has been designed for the analysis of brain imaging data sequences. The sequences can be a series of images from different cohorts, or time-series from the same subject.
  • The Matrix Computation Toolbox – The Matrix Computation Toolbox is a collection of MATLAB M-files containing functions for constructing test matrices, computing matrix factorizations, visualizing matrices, and carrying out direct search optimization.
  • The Matrix Function Toolbox – The Matrix Function Toolbox is a MATLAB toolbox connected with functions of matrices.
  • Wavelab – A free wavelets toolbox from Stanford.

I’ll update this page whenever I come across other quality free toolboxes.  Feel free to point me to more in the comments section but please only do so if you have used the toolbox extensively and you are willing to talk to me about it via email.

Update (29th March 2010):Added the Poblano and Tensor toolboxes along with several from Manchester University.

February 8th, 2010 | Categories: java, programming | Tags:

A friend of mine got me interested in JavaFX recently and my interest grew when I discovered that it had some nice charting functionality.  Dean Iverson has written some great tutorials on the subject over at his blog and includes a link to a demo showing some of the different plot types that are available.

The demo is called ChartDemo and can be found here

http://pleasingsoftware.blogspot.com/2009/06/this-is-test.html

In an ideal world you simply have to click on the demo’s screenshot for it to download and launch but that wasn’t what happened for me.  What happened when I clicked on it was nothing.  No error messages…just nothing.  It’s difficult to google ‘nothing happened’ and get something useful so I downloaded the demo (which had the filename ChartDemo.jnlp) and tried to launch it from the command line using

javaws ChartDemo.jnlp

This gave me the error message

netx: Unexpected net.sourceforge.jnlp.ParseException: Invalid XML document syntax. at
net.sourceforge.jnlp.Parser.getRootNode(Parser.java:1200)

What follows is the story of how I eventually got this demo to work in the hope that it will help someone out there.

So, first things first, what are some of the relevant system specs I am using?  Well, I am running 32bit Ubuntu Linux 9.10 (Karmic Koala) and

java -version

gives

java version "1.6.0_0"
OpenJDK Runtime Environment (IcedTea6 1.6.1) (6b16-1.6.1-3ubuntu1)
OpenJDK Server VM (build 14.0-b16, mixed mode)

Now, when I googled the error message I discovered that Linux (more specifically, I guess, the OpenJDK) is much more sensitive to xml errors than Windows/Mac OS X (.jnlp files are written in xml).  Take double quotes for example; according to the W3C XML recommendations you should not use \” inside an xml attribute but should use “&quot;” instead.  Some java implementations don’t seem to care but, at the time of writing at least, OpenJDK definitely does.  Follow this link to see the original discussion thread where I learned this.

The practical upshot of this extra level of strictness is that .jnlp files that work just fine on Windows and Mac OS X won’t work on Linux and I guessed that was what as happening here.  Sadly there were no examples of \” in ChartDemo.jnlp for me to change to “&quot;” so there must be something else ‘wrong’ with it; but what?

I decided to try the ‘stare at it until you figure it out’ approach to debugging and left the laptop on the side of the sofa while watching a movie on TV.   About halfway through the movie, inspiration struck and I changed the line

<update check="background">

to

<update check="background"/>

which got things past the xml parsing stage. Sadly, I then hit another problem. Rather than a working ChartDemo, my efforts were rewarded with nothing more than just a blank window and a load of java errors in the terminal. When I say ‘a load’ I mean HUNDREDS and none of them looked particularly illuminating. I was starting to remember why I had avoided Java in the past but was not about to give up so easily.

Let’s take stock:

  • The .nlbp file was fine (or at least didn’t return any parse errors)
  • The ChartDemo code must be bug free because if it wasn’t then the author would have been told so rather quickly in the comments section of his blog
  • My Java setup was presumably fine since I was able to run other JavaFX examples. For example I successfully worked through a JavaFX programming tutorial on Sun’s website without incident.

Of those three points I figured that the third one was the most likely to be wrong. It was OpenJDK’s handling of the .jnlp file that caused my first problem so maybe it was causing this second problem too. Could I switch from using OpenJDK to a different version of Java I wondered? Some googling ensued and I discovered some useful incantations.

I can list the versions of Java installed on my machine with the command

sudo update-java-alternatives -l

to get

java-6-openjdk 1061 /usr/lib/jvm/java-6-openjdk
java-6-sun 63 /usr/lib/jvm/java-6-sun

I can change from the openjdk to sun-java with

sudo update-java-alternatives -s java-6-sun

Once I did this I tried to run the ChartDemo.nlbp file again:

javaws ChartDemo.jnlp

and it worked perfectly. I was rewarded with a very nice demo of JavaFX’s charting functionality and Dean’s tutorials proved to be very useful to me. So useful in fact that I bought his book.

Incidentially, the java-6-sun version of java doesn’t care about the syntax of the .jnlp file quite so much as openjdk. However, if you want to change back to using openjdk you can do

sudo update-java-alternatives -s java-6-openjdk

I hope this little tale helps someone out there. Let me know if it does and also feel free to let me know if I have got anything wrong. My knowledge of all things Java is rather basic at the moment to say the least – something I am trying to change.