
Python/NAG Part 2 – Plotting the cosine integral
This is part 2 of a series of articles devoted to demonstrating how to call the Numerical Algorithms Group (NAG) C library from Python. Click here for the index to this series.
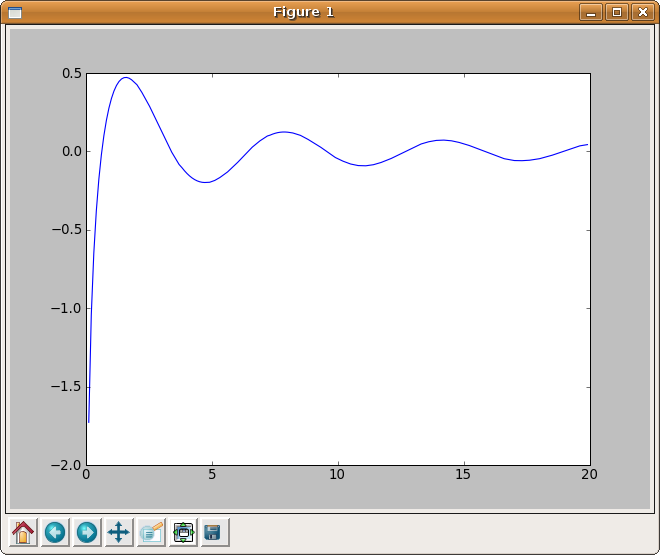
In part 1 I explained how to calculate the Cosine Integral, Ci(x), using Python and the NAG C library but the example code was a little dull in that it only calculated Ci(0.2). Before moving onto more advanced topics I thought it would be fun to use the python module, matplotlib, to generate a plot of the cosine integral.
#!/usr/bin/env python
from ctypes import *
import matplotlib.pyplot as plt

libnag = cdll.LoadLibrary("/opt/NAG/cllux08dgl/lib/libnagc_nag.so.8")
s13acc = libnag.s13acc
s13acc.restype=c_double

fail=c_int(0)
def nag_cos_integral(x):
	x=c_double(x)
	result= s13acc(x,fail)
	return result

xvals = [x*0.1 for x in range(1,200)]
yvals = map(nag_cos_integral,xvals)

plt.plot(xvals,yvals)
plt.show()
Click here to download this program – you’ll need a copy of the NAG C library to make it work. The output is shown below.
Leave a comment
| Trackback