
Interactive Fourier Series with SAGE math
Earlier today I was chatting to a lecturer over coffee about various mathematical packages that he might use for an upcoming Masters course (note – offer me food or drink and I’m happy to talk about pretty much anything). He was mainly interested in Mathematica and so we spent most of our time discussing that but it is part of my job to make sure that he considers all of the alternatives – both commercial and open source. The course he was planning on running (which I’ll keep to myself out of respect for his confidentiality) was definitely a good fit for Mathematica but I felt that SAGE might suite him nicely as well.
“Does it have nice, interactive functionality like Mathematica’s Manipulate function?” he asked
Oh yes! Here is a toy example that I coded up in about the same amount of time that it took to write the introductory paragraph above (but hopefully it has no mistakes). With just a bit of effort pretty much anyone can make fully interactive mathematical demonstrations using completely free software. For more examples of SAGE’s interactive functionality check out their wiki.
Here’s the code:
def ftermSquare(n):
return(1/n*sin(n*x*pi/3))
def ftermSawtooth(n):
return(1/n*sin(n*x*pi/3))
def ftermParabola(n):
return((-1)^n/n^2 * cos(n*x))
def fseriesSquare(n):
return(4/pi*sum(ftermSquare(i) for i in range (1,2*n,2)))
def fseriesSawtooth(n):
return(1/2-1/pi*sum(ftermSawtooth(i) for i in range (1,n)))
def fseriesParabola(n):
return(pi^2/3 + 4*sum(ftermParabola(i) for i in range(1,n)))
@interact
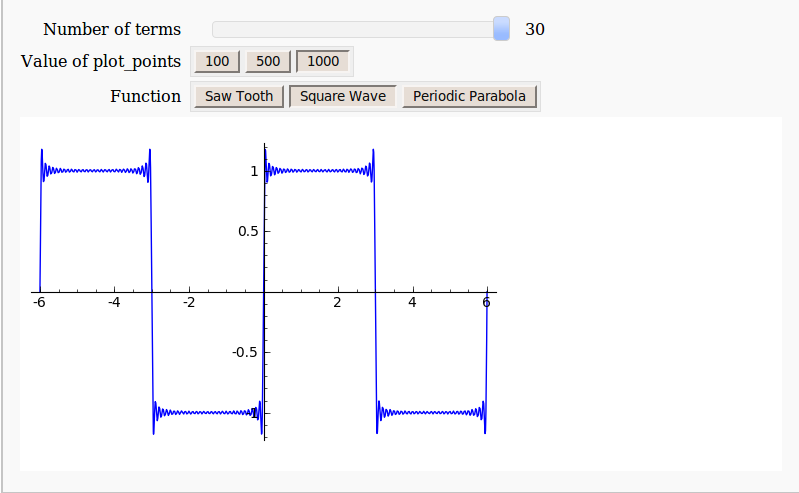
def plotFourier(n=slider(1, 30,1,10,'Number of terms')
,plotpoints=('Value of plot_points',[100,500,1000]),Function=['Saw Tooth','Square Wave','Periodic Parabola']):
if Function=='Saw Tooth':
show(plot(fseriesSawtooth(n),x,-6,6,plot_points=plotpoints))
if Function=='Square Wave':
show(plot(fseriesSquare(n),x,-6,6,plot_points=plotpoints))
if Function=='Periodic Parabola':
show(plot(fseriesParabola(n),x,-6,6,plot_points=plotpoints))
Neat. I run Sage under Ubuntu and have not yet ventured into scripting. Assuming I save your program as a file, where do I save it and how do I invoke it?
Hi
You could just copy and paste it into the notebook interface – that’s all I’m doing at the moment.
Cheers,
Mike
@Swulf: you can copy/paste the entire code into one cell in the notebook and execute it. that’s all. it doesn’t work on command line, since this is based on html.
Manipulate[
Plot[FourierSeries[fun[w] // N, w, m], {w, 0,
2}, Evaluated -> True], {m, {10, 20, 30}}, {fun, {SquareWave,
SawtoothWave}}]
Gives you something similar, although much slower in Mathematica. The slowness comes from computing the fourier series all the time, rather then writing explicitly what it is like in the example above. you could of cause write the series as above and it would be instant like I asume the sage example is.
Personally I much prefer mathematica because it becomes possible to write code which exactly resembles the formula in the book. Usually students have a sort of code-chock when they have to translate mathematics into a program, with mathematica most the time this translation isn’t needed.
Bravo!
It’s always nice to see someone else using sage. This is a very concise way to show Fourier series too! Excellent code.
@Clinton – glad you like it. I am always slightly nervous when posting code because if I make a mistake then I quickly get jumped on. It’s a good way to learn though :)
@Vincent – Yep, that works but you are right – it is VERY slow. Far too slow to be interactive I think. If I were to code up a Mathematica version of this SAGE interaction then it would end up looking very similar to the Python code in the main post and the performance would be similar.
Hi Mike,
Thanks to you post I found SAGE and I have to say I like it. Can you please contact me on the email I have provided. I would like to ask you something about the blog.
Cheers
A.
Just got home and took a quick stab at it, and it’s similar in function as the sage code, but has a higher resemblance to textbook math. (note that it looks even simpler in 2d-math mode).
saw = 1/n Sin[n x Pi/3];
square = 1/(2 n – 1) Sin[(2 n – 1) x Pi/3];
polynomial = (-1)^n/n^2*Cos[n x];
Manipulate[
Plot[Sum[fn, {n, 1, nmax}], {x, 0, 10}, Evaluated -> True], {nmax, 1,30, 1},
{{fn, saw}, {saw -> “Saw”, square -> “Square”, polynomial -> “Polynomial”}}]
Also I found myself surprised that Mathematica actually returned a resulting expression for the sum
Sum[1/n Sin[n x Pi/3],{n,1,nmax}]
before I specified nmax. It’s a three term thing using the LerchPhi function so I won’t write it. Sometimes you sorta feel like your dealing with a hyperintelligen autistic boy on speed when dealing with Mathematica.
Inspired by your Sage @interact posts, I decided to try my hand at one. I’ve made one, and thought a fun way to share it would be the ‘Publish’ option at sagenb.org. However, while the code shows up, the @interact-ivity doesn’t run. Have you used sagenb.org, and successfully published an @interact-ive worksheet, that I might look at and see what I’m doing wrong?
Hi Nick
I have never used sagenb.org but I suggest that you send a message to the guys at sage-support asking for advice
http://groups.google.com/group/sage-support
They are a friendly bunch and have helped me out a number of times.
Looking forward to seeing your interaction.
Cheers,
Mike
Thanks @Mike. I did dig around on those groups a little, and found that @interact-ive bits are turned off, on purpose, for published worksheets. Understandable, from a resources and probably security standpoint, but too bad, nonetheless. Apparently it’s a goal to get these things changed, so maybe someday…
Hello,
I was locking for a language / software for implement my theoretic model.
Now, I think I found it.
I’m very impressed about sage, sagenb.org and @interact.
Best wishes for all,
Marius
@Swulf
just paste it into a cell of sage/python notebook and press shift+enter
(a good way of learning programming is to comment other people’s programs)