
Polygonal numbers on quadratic number spirals
Over at Mathrecreation, Dan Mackinnon has been plotting two dimensional polygonal numbers on quadratic number spirals using a piece of software called Fathom. Today’s train-journey home project for me was to reproduce this work using Mathematica and Python.
I’ll leave the mathematics to Mathrecreation and Numberspiral.com and just get straight to the code. Here’s the Mathematica version:
- Download the Mathematica Notebook
- Download a fully interactive version that will run on the free Mathematica Player
p[k_, n_] := ((k - 2) n (n + 1))/2 - (k - 3) n;
Manipulate[
 nums = Table[p[k, n], {n, 1, numpoints}];
 If[showpoints,
  ListPolarPlot[Table[{2*Pi*Sqrt[n], Sqrt[n]}, {n, nums}]
   , Joined -> joinpoints, Axes -> False,
   PlotMarkers -> {Automatic, Small}, ImageSize -> {400, 400}],
  ListPolarPlot[Table[{2*Pi*Sqrt[n], Sqrt[n]}, {n, nums}]
   , Joined -> joinpoints, Axes -> False, ImageSize -> {400, 400}
   ]
  ]
 , {k, 2, 50, Appearance -> "Labeled"}
 , {{numpoints, 100, "Number of points"}, {100, 250, 500}}
 , {{showpoints, True, "Show points"}, {True, False}}
 , {{joinpoints, True, "Join points"}, {True, False}}
 , SaveDefinitions :> True
 ]
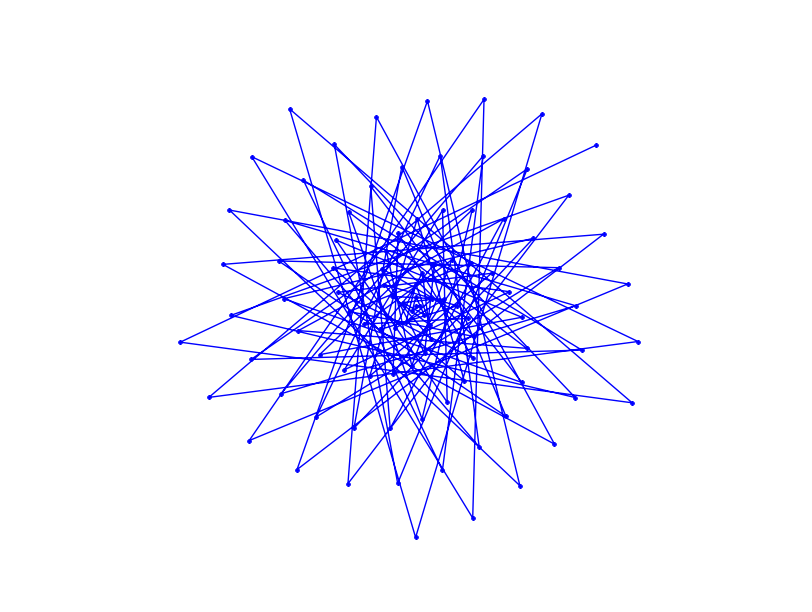
A set of 4 screenshots is shown below (click the image for a higher resolution version). The formula for polygonal numbers, p(kn,n), is only really valid for integer k and so I made a mistake when I allowed k to be any real value in the code above. However, I liked some of the resulting spirals so much that I decided to leave the mistake in.

When Dan showed the images he produced from Fathom, he mentioned that he would one day like to implement these systems in a more open platform. Well, you can’t get much more open than Python so here’s a piece of code that makes use of Python and the matplotlib package (download the file – polygonal_spiral.py).
#!/usr/bin/env python import matplotlib.pyplot as plt from math import * def p(k,n): return(((k-2)*n*(n+1))/2 -(k-3)*n) k=13 polygonal_nums = [p(k,n) for n in range(100)] theta = [2*pi*sqrt(n) for n in polygonal_nums] r = [sqrt(n) for n in polygonal_nums] myplot = plt.polar(theta,r,'.-') plt.gca().axis('off') plt.show() |
Now, something that I haven’t figured out yet is why the above python code works just fine for 100 points but if you increase it to 101 then you just get a single point. Does anyone have any ideas?
Unlike my Mathematica version, the above Python program does not give you an interactive GUI but I’ll leave that as an exercise for the reader.
If you enjoyed this post then you might also like:
Thanks Mike! These look great. I’m excited to play with the Python script you’ve created. I’ve never used the mathplot module (really, only used a little Python, mostly via Jython) – looking forward to exploring that also.
Blimey Dan…that was quick. I was about to email you to let you know about this page and yet you’ve found it already. Just a quick typo correction though – the module is matplotlib not mathplot :)
Thanks for the inspiration by the way. I love it when simple mathematics results in very pretty pictures.
The problem with more than 100 points looks like a bug in the polar function of matplotlib. In the expression for theta, replace 2*pi*sqrt(n) with 2*pi*sqrt(n) % 2*pi and then it works as expected.
Awesome! I’m a sucker for sweet graphs :)
@Dave Thanks for that. I’ll mention it to the matplotlib guys.
@Joshua – you and me both :)
So of course now I’ve had to spend my afternoon writing a MATLAB GUI version. Damn you!
Hey Matt – sounds good.
Care to share? I’d love to see it.
Sure! How? (I could post the code but… ewww)
@Matt – I’ll email you
Mike, I enjoy condensing code. How does this look?
p[k_,n_] := Sqrt[ ((k - 2) n (n + 1))/2 - (k - 3) n ] Manipulate[ ListPolarPlot[Array[{2 Pi #, #}&[k ~p~ #]&, numpoints], Joined -> joinpoints, Axes -> False, PlotMarkers :> If[showpoints, {Automatic, Small}], ImageSize -> {400, 400}], {k, 2, 50, Appearance -> "Labeled"}, {{numpoints, 100, "Number of points"}, {100, 250, 500}}, {{showpoints, True, "Show points"}, {True, False}}, {{joinpoints, True, "Join points"}, {True, False}}, SaveDefinitions :> True ]Hi Paul,
looks good – thanks for that :)
I took the liberty of surrounding your code in PRE tags to preserve the formatting.
Cheers,
Mike