
Simulating Harmonographs
“Do you like pendulums?” I was asked, “because if you don’t like pendulums then I wouldn’t bother with A-Level physics if I were you.” This was the advice given to me by an outgoing sixth-former at a school open day around 14 years ago. He had obviously had an unhappy time during his physics studies and was doing his best to turn me away from the subject but he hadn’t counted on the fact that I actually do like pendulums. Besides, I figured that high-school physics isn’t only about pendulums – they’ve got springs too!
Of course everyone knows what a pendulum is – thing that swings back and forth, used in grandfather clocks. When all is said and done, you might argue that pendulums are simple, sometimes useful and, above all, dull. My sixth-form friend certainly thought so but maybe that was because he didn’t have enough pendulums!
One pendulum is useful but two are much more interesting and four can be downright fun! The Victorians certainly thought so and over 100 years ago they used to build home entertainment devices out of pendulums called harmonographs. You have probably never heard of a harmonograph (I certainly hadn’t until a couple of days ago) and so maybe a bit of detailed explanation is in order.
Imagine that you have attached a pencil to a pendulum so that it brushes across a piece of paper as the pendulum swings back and forth. When the pendulum finishes swinging you will end up with a single straight line drawn on your paper – very dull indeed! Now imagine further that you somehow manage to connect a second pendulum to your pencil which oscillates at right angles to the first. The resulting drawing might look something like the image below. If your imagination fails you (or if my explanation isn’t up to the job) then you can see a video of the set up I am trying to describe by clicking here.

Alternatively, you could have one pendulum attached to the pencil and another attached to the drawing surface as in the example below.

There are many different designs for harmonographs and some manage to incorporate up to 4 different independent oscillations by attaching pendulums to the drawing surface as well as the pencil itself. The resulting drawings can be spectacular.


So how might we go about simulating a harmonograph? Well the motion of a single damped pendulum along the x axis can be described by the parametric equation
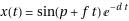
where t denotes time, p is a phase factor between 0 and 2*pi and d is the strength of the damping term. The larger you make d, the more quickly the pendulum oscillations will decay.
If we have two independent pendulums oscillating along the x-axis, both contributing to the overall motion of our pencil then, thanks to the principle of superposition, the total motion along the x-axis is given by

If we also have two pendulums oscillating along the y-axis then the final set of equations is
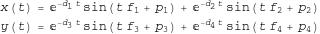
Now, if you search the internet you will find that other people have written down equations for harmonograph plots and you might find that they look slightly different to the ones I have written above but you should always be available to transform my equations into any other valid set. For example, the equations given in the website here describe a system with only three pendulums so simply cross out the second term for y(t) in my set of equations and you are almost done. You might also find that some people use Cosine instead of Sine – in which case you simply set the phase in my equations to be pi/2 since sin(x+pi/2) = cos(x).
Something else I have done is to assume that the initial amplitude of all of my pendulums is set to one. This is because I already have 12 parameters to play with which I think is more than enough for an initial play around.
As an aside, it turns out that these equations can describe much more than just Harmonographs. For example, by setting the damping factors to 0 and by crossing out the second term in each equation (thus only considering 2 oscillators) you will end up with Lissajous figures. With a bit of algebraic manipulation you can also obtain the equations that describe spirograph curves – see this link for the details.
So, we have a set of parametric equations and we want to plot the result. In Mathematica the ParametricPlot command is what we need so let’s give our 12 parameters some numbers and see what we can come up with.
ParametricPlot[{Sin[2 t + Pi/16] Exp[- 0.02 t] + Sin[6 t + 3 Pi/2] Exp[-0.0315 t], Sin[1.002 t + 13 Pi/16] Exp[-0.02 t] + Sin[3 t + Pi] Exp[-0.02 t]}, {t, 0, 167}, PlotRange -> All, Axes -> None]

This is all very nice but it would be much nicer if we could manipulate the parameters with a set of sliders rather than having to manually type them in each time. My first attempt at producing such a graphical user interface to the above function in Mathematica looked like this (click the image to download an interactive notebook version that can be used in the free Mathematica Player application from Wolfram)
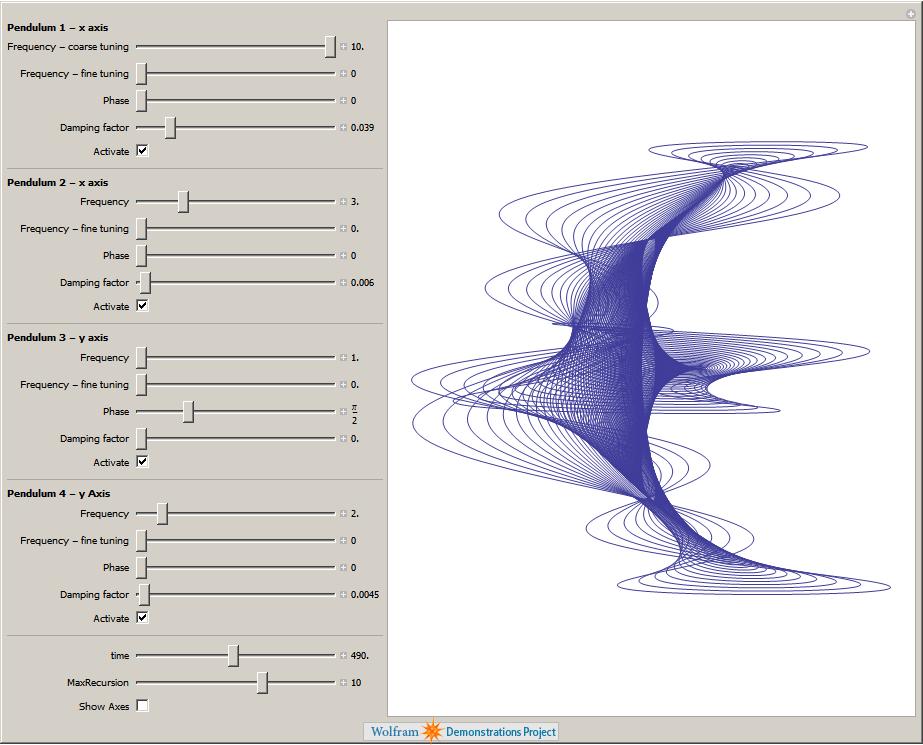
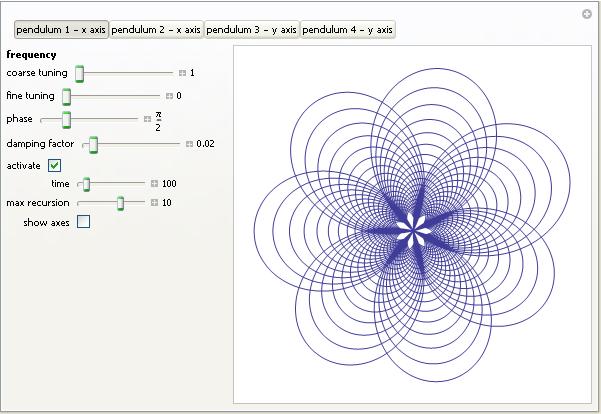
I quite like this version as you can see all of the parameters at once but it turned out to be too big for inclusion in the Wolfram Demonstrations Project. I tried various tricks to try and shoe-horn all of those parameters into a smaller applet and was about to give up when an employee at Wolfram sent me some code that sorted out the size problem by introducing a set of tabs. I like his solution so much that I’ll probably be writing about it soon in a separate article. The resulting Wolfram Demonstration was published today – click on the image below if you’d like to take a look.
Things that I haven’t done yet but might in the future include
- Animate the plot so that it looks more like the real thing.
- Add colour.
- Add the ability to modify the starting amplitude of each pendulum.
Of course the source code is available so if you have a burning desire to do any of these yourself then feel free – but please let me know if you do. I hope that you enjoy the results of these applets and would love to see any particularly interesting images that you might come up with – sending the equation parameters would be useful as well.
Parameters for reproducing the images above
Hover your mouse over a plot to see what image number it is
- Image 1: f1=3.001 f2=2 f3=3 f4=2 d1=0.004 d2=0.0065 d3=0.008 d4=0.019 p1=0 p2=0 p3=pi/2 p4=3pi/2
- Image 2: f1=10 f2=3 f3=1 f4=2 d1=0.039 d2=0.006 d3=0 d4=0.0045 p1=0 p2=0 p3=pi/2 p4=0
- Image 3: f1=2.01 f2=3 f3=3 f4=2 d1=0.0085 d2=0 d3=0.065 d4=0 p1=0 p2=7 pi/16 p3=0 p4=0
- Image 4: f1=2 f2=6 f3=1.002 f4=3 d1=0.02 d2=0.0315 d3=0.02 d4=0.02 p1=pi/16 p2=3pi/2 p3=13 pi/16 p4=pi
Harmonograph Resources
Hopefully, this article has whetted your appetite for harmonographs – if so then you might find the following resources interesting.
- How to Make a Three-Pendulum Rotary Harmonograph by Karl Sims
- Instructions for building your own harmonograph from chestofbooks.com
- More instructions for making harmonographs from 1920-30.com.
- Analysis of a home built harmonograph – a great model, I’m not sure about his equations though.
- Harmonograph – A visual guide to the Mathematics of Music
. A book by Anthony Ashton.
- The Meccano Super Models (Volume 2) by Geoff Wright. ISBN 0-904568-07-5 contains instructions for making a Harmonograph out of Meccano. I can’t get hold of a copy unfortunately.
- The following two journal articles contains some interesting historical and technical information concerning harmonographs.
- American Journal of Physics — February 2001 — Volume 69, Issue 2, pp. 162-173
- American Journal of Physics — February 2001 — Volume 69, Issue 2, pp. 174-183
- Harmonograph simulator written in tcl.
- Java Harmonograph simulator.
If you enjoyed this article, feel free to click here to subscribe to my RSS Feed.
Great and beautiful work!
I´ve come here via Reasonable Deviations.
Great work. I didn’t know about harmonographs, and it surely whetted my appetite.
In some of the youtube videos the pendulums are started with large amplitudes, and I wonder whether the non-linearity is important.
I think it can be interesting to make the Mathematica simulations with NDSolve and to compare. Also you may try various damping modelling.
It took me a while to digest the math for simulating pendulums but your clear writing style helped. I wrote a simulation program that solves the parametric equations, animate a paper and pen, and was able to reproduce one of the images above given the parameters you listed. So it was a great way to check my work. In combination with other resources on the internet and the book “Harmonograph: A Visual Guide to the Mathematics of Music” by Anthony Ashton, this article was definately a key to my understanding.
Try this cool online harmonograph
http://swantesson.com/harmonograph.html
Here’s another harmonograph simulator, this one in JavaScript using the HTML5 canvas element:
http://typethinker.blogspot.com/2010/03/harmonograph-in-javascript.html
Requires a recent browser that is not IE.
Some artwork created using a single pendulum:
You might also look at that: http://www.youtube.com/watch?v=UZgJVDmD2vo (Harmonograph for iPad)
Hi,
I used to have a harmonograph as a child, I’ve been looking for one to buy for my niece but can’t seem to find one anywhere. Does anyone have any idea of where I can find one?
Very nice, very interesting. I am reading a book called “Quadrivium”, (the four classical arts taught in schools in the Middle Ages – Numerics, Geometry, Music & Cosmology), and I encountered my first example of a “harmonograph”. Grabbed the Playbook, and googled the term for more examples, and found your impressive site. Ever seen an example in GNUplot? I’ve just ported a version of GNUplot to the Blackberry Playbook, and I’m waiting for RIM to approve it. I think I can simulate the harmonograph for an octave in GNUplot, as it has parametric plotting ability. Your equations will give me a good starting point. Thanx.
– Rus.
Hey, My teacher allowed us for our final project to basically create any project as long as it proves an area of calculus. I love the idea of Harmonographs and I would love to do them…But i wanted to make sure this could work? Do you think I need to code a simulation program? Or actually build it? This article really helped me understand the background behind it…thanks!
Hi Rae
I have no idea I’m afraid since I don’t know what your teacher is expecting. I suggest you discuss it with your teacher.
Good luck!
Cheers,
Mike
Any chance you will write a similar article about pintographs? The output is a lot prettier in my opinion.