
Archive for July, 2015
Due to the demands of my job and the fact that I like shiny new technology, I’m pretty much operating system agnostic these days. I find myself flitting between Windows, Linux, Mac OS X, Android and iOS on a regular basis and find them all delightful and head-smackingly frustrating in equal measure.
One of my geeky guilty pleasures is taking some time out to kick the tyres of a new operating system and so I’m having a lot of fun with Windows 10 right now. I tend not to play with preview builds so all of this is new to me.
The Windows command prompt hasn’t seen much love in decades and yet it’s so important to the work I do. In Windows 10, it’s received a much needed update. Right at the top of the list are improvements to copy and paste. In older versions of windows, this is my workflow I go to a new machine:
- Using CTRL-V, try to copy and paste into the command line. It doesn’t work. You get ^V appear instead
- Sigh and mutter to yourself. Right click on the top of the window. Choose properties. Enable Quick Edit mode.
- Press CTRL-V again. ^V appears. Press it a few more times ^V^V^V^V
- Remember that in cmd.exe, unlike all other applications in Windows, the way to paste is to right click. Mutter again. Get on with life.
In Windows 10, quick edit mode is enabled by default and CTRL-V just works. Happy days!
There’s a whole host of other improvements including word-wrap, transparencies, the ability to resize the window and more. I feel like the Windows command prompt has taken its first step into a larger world.
Microsoft have also set up a discussion forum for the future of the Command Prompt.
If you change it, It will break
“It only works on the Windows version of MATLAB 2010a. The code doesn’t work on Linux or other versions of MATLAB.” explained the researcher. He needed to run his program hundreds of times and his solution was to lock himself into a computer room over the weekend, log into the two dozen managed desktop machines there and manually start his code running on each one. Along with colleagues from the University of Manchester, I was trying to understand why he couldn’t use the Linux-based 3000+ core Condor pool we’d built since it was perfectly suited to his workflow.
Now, when he said ‘doesn’t work‘ what he meant was ‘gives different results’ and the only ones he liked were the ones that came from MATLAB 2010a on Windows. Naturally, I offered to take a look at his code with a view to figuring out what was going on but he simply wasn’t interested. Once he determined that we couldn’t (or more accurately, wouldn’t) stop his current workflow he thanked us for our interest and left.
Different strokes results for different folks
This wasn’t the first time I had discovered research code that gave different results when run on different operating systems or runtimes and it probably won’t be the last. A relatively high profile case that caught my eye recently was a publication that demonstrated that the results of a program called FreeSurfer varied according to operating system, workstation type and software version.
I suspect that the phenomenon might be more prevalent than we think because I suspect (but confess to having no evidence) that a large number of computational research results come from research code that’s only ever been run on one operating system, with one set of dependencies on one particular piece of hardware.
Experience has shown me that some researchers deal with this lack of robustness by keeping their working environment as constant as possible. Don’t. Touch. Anything!
The shifting sands of Windows 10
A huge percentage of researchers conduct their research using Windows and the Windows environment is about to change in a rather fundamental way: Updates will be automatic and mandatory.
Since the operating system will be constantly shifting under their feet, researchers are no longer going to be able to keep that aspect of their environment stable.
I wonder if or how this will change things in the world of research software. Perhaps it will go by unnoticed, perhaps more test-suites will be written or perhaps something else?
Any thoughts?
You’ve written a computer program in your favourite language as part of your research and are getting some great-looking results. The results could change everything! Perhaps they’ll influence world-economics, increase understanding of multidrug resistance, improve health and well-being for the population of entire countries or help with the analysis of brain MRI scans.
Thanks to you and your research, the world will be a better place. Life is wonderful; this is why you went into research.
It’s just a shame that you’re completely wrong but don’t yet know it.
What went wrong?
If you click on any of the studies linked to above, you’ll find a common theme – problems with software. These days it’s close to impossible to do science without either using or developing specialist software. Using research software can be difficult, complex and extremely time consuming. Developing it is orders of magnitude more difficult.
What can be done?
When I’m writing code, my first and main assumption is always ‘I can be an idiot and will make mistakes.’ Some people I’ve worked with assume that I’m either being self-deprecating or have a self-confidence problem when I talk like this. The reality is that it’s simply true. I’m fallible: my knowledge of everything is incomplete and if I haven’t had at least two cups of coffee in the morning, I’m essentially good for nothing.
Rather than lament my weaknesses, I try to develop methods of working that mitigate my inevitable stupidity. These methods are actually very simple.
- Write tests. Every programming language worth its salt provides testing frameworks (e.g. Python, MATLAB, R). Learn how to use them and use them whenever you can. Whenever you make a change to your code or install it somewhere new, run your tests to see if anything has broken.
- Get a code buddy. Find yourself another programmer and hand them your code with the remit ‘Tell me where you think I could do better’. This will be a painful experience. Suck it up because your code will almost certainly be better as a result. There is only one true measure of code quality!
- Use version control. It doesn’t matter if its git, SVN, Mercurial or whatever the particular flavour of the month is. Choose a system, learn it and use it (for the record, I use git and have a twitter account called @git_tricks that posts tips on how to use it). When you use your code to get results, refer back to the actual commit that you used to get those results. This greatly assists the reproducibility of your research. If you cannot reproduce your own results with your own code and data, neither can anyone else.
- Share code as openly as possible. Ideally, ‘openly’ should mean on the public internet. GitHub, blog posts, personal websites etc. Whenever I’ve posted code here on WalkingRandomly, mistakes usually get caught very quickly. Geeks love telling other geeks that they’ve made a mistake. Sure, your pride takes a hit but you quickly become immune to such things. The code is better, you learn something useful and the geeks that point out your errors feel good about themselves. Everyone’s a winner.
Sadly, the great majority of scientists I work with really don’t want to share their code openly for numerous reasons and so much of the stuff I’ve worked on is in the dark. Sometimes, collaborators don’t even want to share code with me.I’m about to start work on one optimisation case where the researcher tells me that they are not allowed to email me their code. So, he’s bringing his laptop to me and will sit next to me for a few hours while I try to figure out if I can help or not. Such is the lot of a working research software engineer.
Along with organisations such as the Sheffield Open Data Science Initiative and The Software Sustainability Institute, I am trying to improve this state of affairs but have to admit that progress is slower than I’d like.
These steps won’t guarantee that your code is correct but they are great steps in the right direction. For more in-depth advice, I refer you to Greg Wilson’s paper Best Practices for Scientific Computing.
It is possible to write quick, interactive demonstrations in a variety of languages these days. Functions such as Mathematica’s Manipulate, Sage Math’s interact and IPython’s interact allow programmers to write functional graphical user interfaces with just a few lines of code.
Earlier this week, I hosted a session in the Faculty of Engineering at The University of Sheffield where Maplesoft showed us, among other things, their version of this technology. This blog post is an extension of my notes from this part of the session.
- The Maple Worksheet for this blog post is available on github.
The series command expands a function as a power series around a point. For example, let’s expand sin(x) as a power series around the point x=0.
series(sin(x), x = 0, 10)

If we try to plot this, we get an error message
plot(series(sin(x), x = 0, 10), x = -2*Pi .. 2*Pi, y = -3 .. 3)

Warning, unable to evaluate the function to numeric values in the region; see the plotting command's help page to ensure the calling sequence is correct
This is because the output of the series command is a series data structure — something that the plot function cannot handle. We can, however, convert this to a polynomial which is something that the plot function can handle
convert(series(sin(x), x = 0, 10), polynom)

Wrapping the above with plot gives:
plot(convert(series(sin(x), x = 0, 10), polynom), x = -2*Pi .. 2*Pi, y = -3 .. 3);

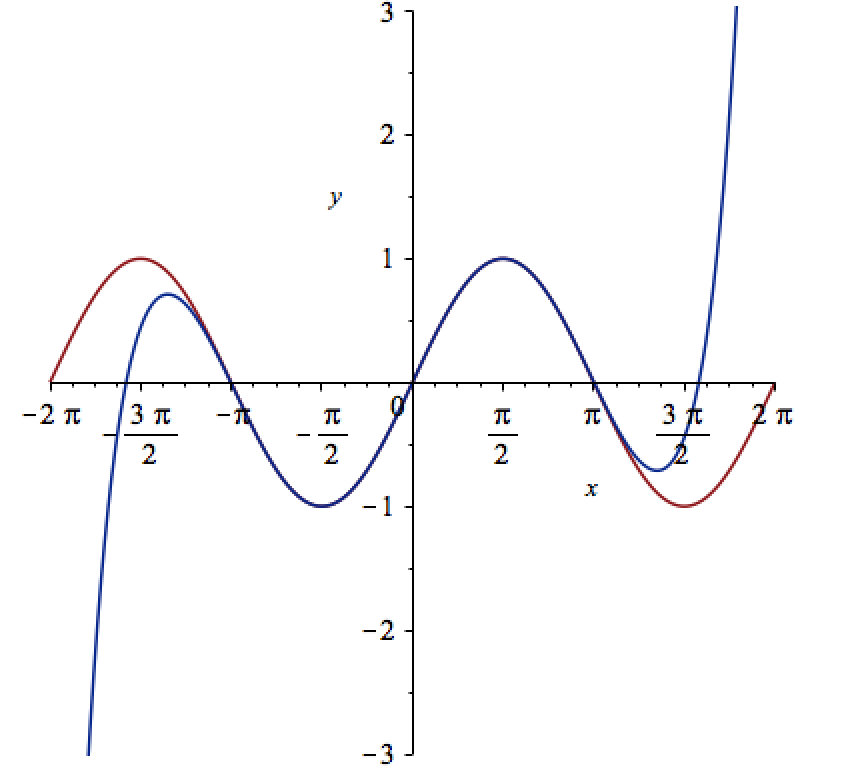
Let’s see how close this is to the sin(x) curve by plotting them both together
plot([sin(x), convert(series(sin(x), x = 0, 10), polynom)], x = -2*Pi .. 2*Pi, y = -3 .. 3);
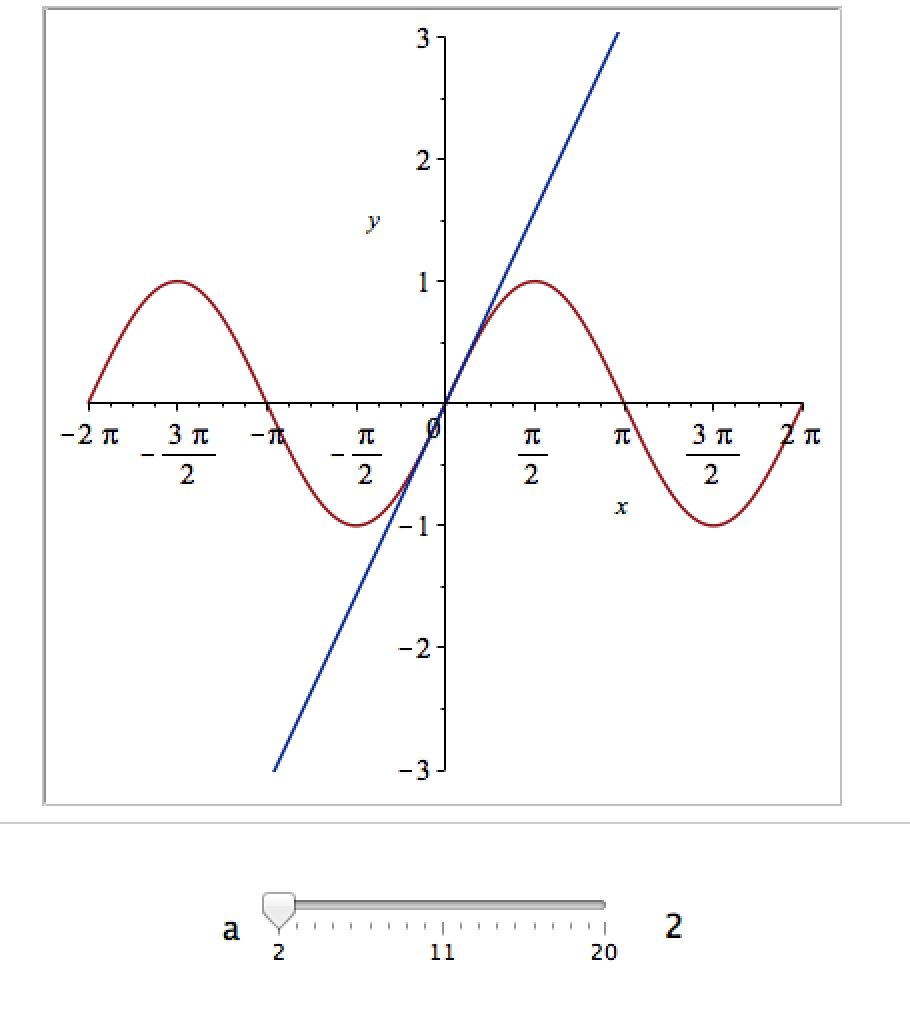
It would be nice if we could see how the approximation varies as we vary the number of terms in the expansion. Change the value 10 to a parameter a, pass the whole thing to the Explore function and we get an interactive widget.
Explore(plot([sin(x), convert(series(sin(x), x = 0, a), polynom)], x = -2*Pi .. 2*Pi, y = -3 .. 3), parameters = [a = 2 .. 20]);
Here’s a screenshot of it:
Adding extra parameters
It would also be nice to vary the point we expand around. Change the value 0 to b and add an extra parameter to Explore to get two sliders instead of one:
Explore(plot([sin(x), convert(series(sin(x), x = b, a), polynom)], x = -2*Pi .. 2*Pi, y = -3 .. 3), parameters = [a = 2 .. 20, b = -2*Pi .. 2*Pi]);
To see what this looks like, open the companion worksheet in Maple.
Adding labels to the sliders
We can change the labels on the sliders as follows
Explore(plot([sin(x), convert(series(sin(x), x = b, a), polynom)], x = -2*Pi .. 2*Pi, y = -3 .. 3), parameters = [[a = 2 .. 20, label = `Number Of Terms`], [b = -2*Pi .. 2*Pi, label = `Expansion location`]]);
To see what this looks like, open the companion worksheet in Maple.
Adding initial values
Finally, let’s set some starting values for each slider
Explore(plot([sin(x), convert(series(sin(x), x = b, a), polynom)], x = -2*Pi .. 2*Pi, y = -3 .. 3), parameters = [[a = 2 .. 20, label = `Number Of Terms`], [b = -2*Pi .. 2*Pi, label = `Expansion location`]], initialvalues = [a = 2, b = 1]);
The resulting interactive widget looks like this:

Not bad for one line of code!
Upload to the Maple Cloud
At The University of Sheffield, we are lucky because all of our staff and students have access to Maple on both university-owned and personally-owned equipment. If your audience isn’t as fortunate, they can access the resulting worksheet on the Maple Cloud.
With apologies to Ridley Scott and Rutger Hauer:
I’ve…seen things you people wouldn’t believe.
Compute kernels on fire while looking over the shoulder of Brian. I watched C-code glitter in the dark as it flowed from the automatic generator with no test-rig in sight. There was no version control, no back-up so all those…results…will be lost in time, like tears in rain.
Time to debug.